


- Polkadot breaks resistance, targeting $12 with bullish momentum, reflecting an 83.65% potential increase.
- Key supports at $5 and $6 boost Polkadot’s stability, aiding recent price rebounds.
- RSI at 46.42 hints Polkadot nears oversold, while 1-day MACD signals short-term upward momentum.
Polkadot (DOT) has recently shown signs of a bullish reversal in its price trend as highlighted by Captain Faibik, an analyst. The chart reveals a downward trend line that began in February 2024 and extended to recent levels, acting as a significant resistance. However, a support trend line starting from a low point in September 2023 has formed a descending triangle pattern.
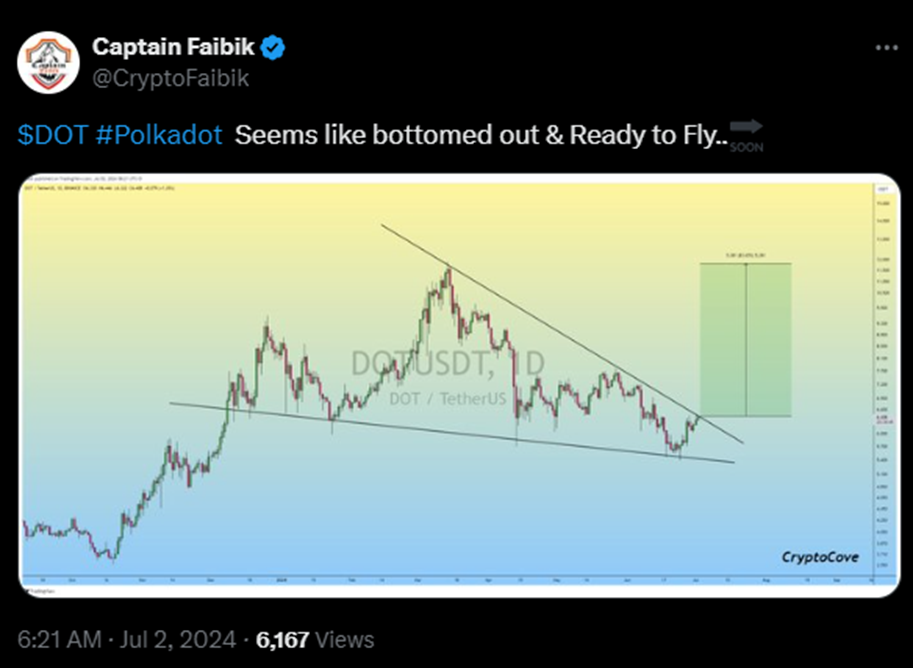
The price of Polkadot has broken above the downward resistance trend line, indicating a potential bullish reversal. This breakout suggests a possible upward move, highlighted by the green projection box on the chart. This breakout is a crucial indicator of a shift in market sentiment.
Support levels have played a vital role in Polkadot’s recent price movements. The lower trend line around the $5.00 mark has been a significant support level multiple times in the past few months. Additionally, another support level around $6.00 has seen price bounces in recent weeks. These levels provide a foundation for the price, helping it to avoid further declines.
Polkadot (DOT) Emerges as an Undervalued Blockchain Powerhouse, Says AnalystOn the resistance side, the breakout level around $6.40, previously a resistance due to the downward trend line, is now acting as support. The next major resistance level is around $12.00, as indicated by the green projection box on the chart. This level coincides with previous highs observed in the chart, making it a significant target for the bullish move.
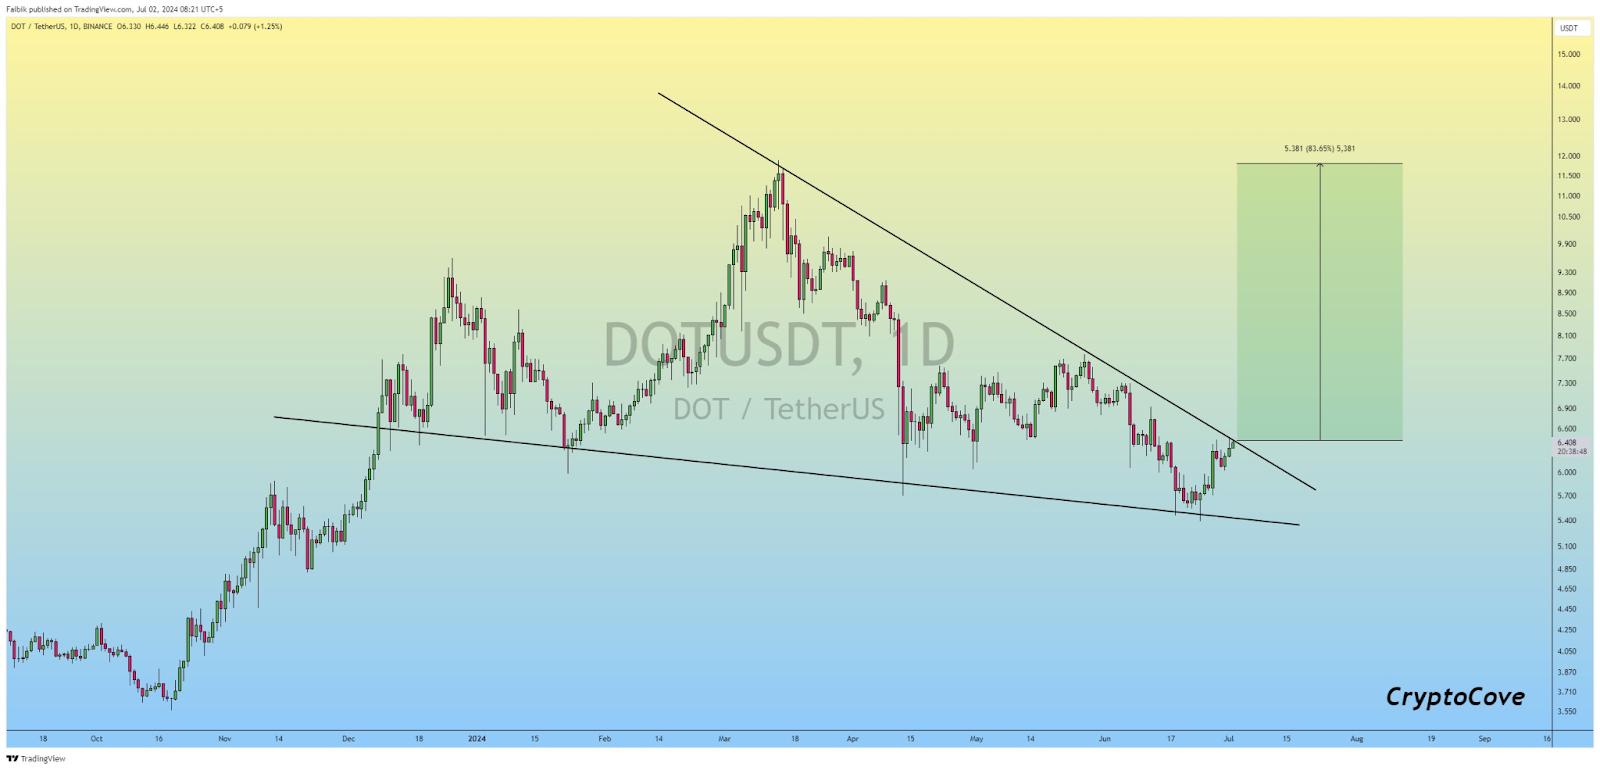
Based on the breakout from the descending triangle pattern, there is an optimistic projection towards the $12.00 level. This represents approximately an 83.65% increase from the breakout point. This projection is ambitious but achievable if the current bullish momentum continues.
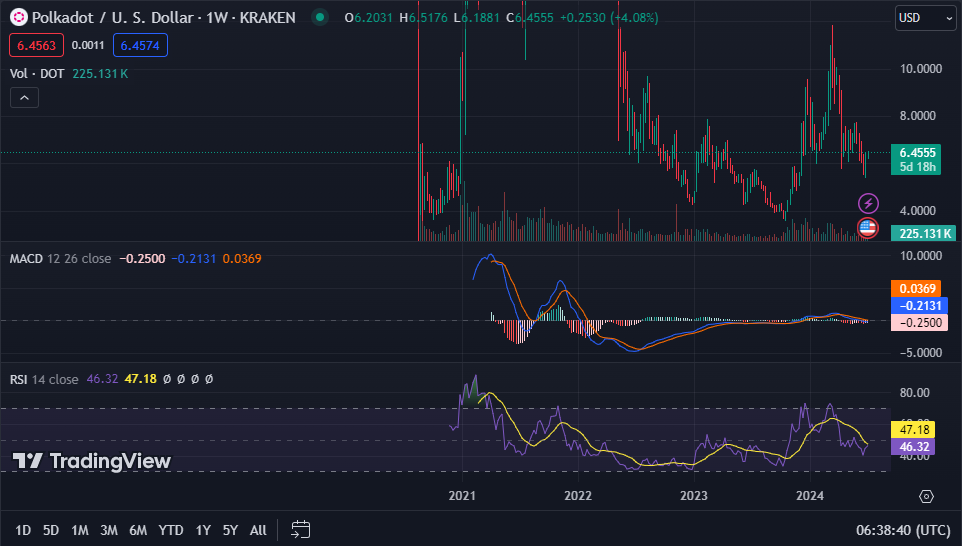
As at press time, Polkadot is trading at $6.36 with a 24-hour trading volume of $203,807,849. The price has increased by 0.69% in the last 24 hours. The 1-week RSI stands at 46.42, indicating that Polkadot may be approaching oversold conditions but is not yet in a strong buying position. Additionally, the 1-day MACD trading above the signal line suggests some upward momentum in the short term for Polkadot.


