
Polkadot (DOT) has been gaining traction following a correction phase, forming a falling wedge pattern on the 12-hour timeframe. This technical setup often indicates a potential reversal. The price of Polkadot stands around $6.27 today, reflecting a 6.86% increase over the past 24 hours and a 7.57% rise in the last week.
With a circulating supply of 1.4 billion DOT, the market cap of Polkadot is valued at approximately $8.7 billion. Per World Of Charts, the critical breakout above the wedge’s upper trendline suggests a possible bullish wave targeting $12, representing an 84.26% upside.
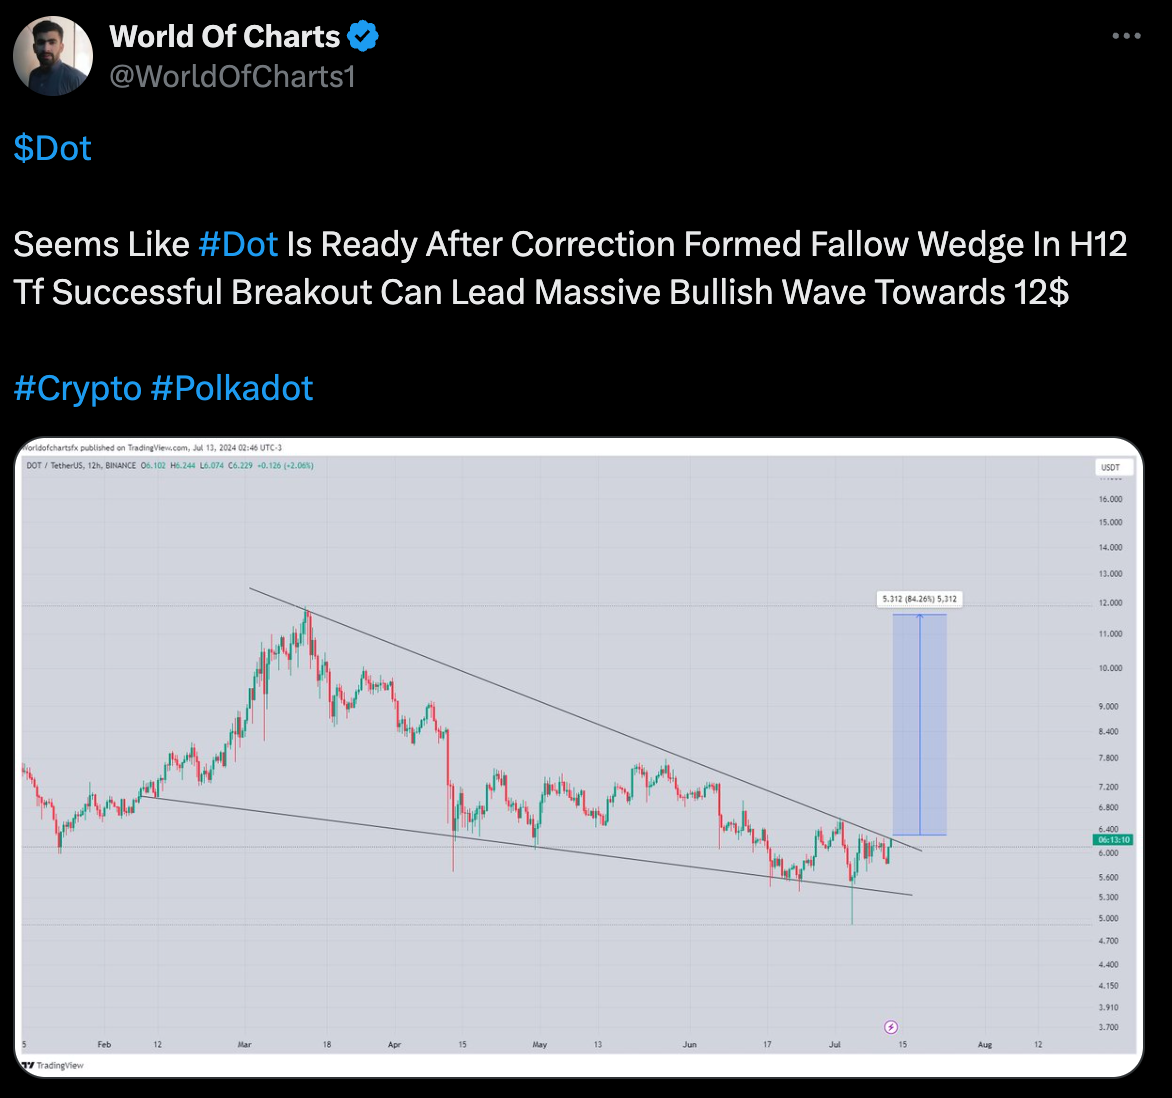
A falling wedge pattern is typically a bullish signal, indicating a potential reversal. The pattern is characterized by two downward-sloping, converging trendlines. Polkadot’s price has been consistently making lower highs and lower lows, adhering to the wedge’s boundaries. The current price action indicates signs of a breakout above the upper trendline. Such breakouts often lead to strong upward movements, suggesting a shift from bearish to bullish momentum.
Polkadot (DOT) Eyes $9.20, Floki (FLOKI) Targets 64.93% Surge: What’s Next?The projected target for the breakout is around $12, based on the height of the wedge at its widest point. This projection implies a substantial gain if the breakout follows through. Immediate resistance levels will be encountered at previous support zones turned resistance. In the event of a false breakout, the lower trendline of the wedge and previous support levels around $6 will be crucial to monitor. Traders should look for confirmation of the breakout with a sustained move above the upper trendline, ideally accompanied by increased trading volume.
In a separate analysis, Maker (MKR) has also shown significant bullish potential according to World Of Charts. The price chart for MKR/USDT on Binance, using a 12-hour timeframe, depicts a descending channel pattern from late March to early July.

The price moved within this channel, testing the upper and lower trendlines multiple times. Around mid-July, the price broke above the upper trendline, indicating a potential trend reversal from bearish to bullish. Post-breakout, MKR’s price surged sharply, reaching levels above $3,700.
Key resistance levels for MKR can be identified around $4,100 and $3,900, where the price faced selling pressure. Support levels are around $2,750 and $2,320, which were previous resistance points within the descending channel. The breakout was accompanied by increased volume, indicating strong buying interest and sustained bullish momentum.
The price of Maker is $2,648.35 at press time, with a 24-hour trading volume of $168.3 million. This represents a 10.22% price increase in the last 24 hours and a 16.93% rise over the past week. With a circulating supply of 930 thousand MKR, Maker’s market cap is valued at approximately $2.46 billion. If the bullish momentum continues, MKR could test higher resistance levels, offering traders potential long positions.

For both DOT and MKR, the focus remains on confirming breakouts and sustaining bullish momentum. Traders should monitor key resistance and support levels while considering volume and price action for potential entry points. The successful breakout of these patterns suggests a promising bullish outlook for both cryptocurrencies, pending further confirmation and market conditions.