

- MATIC forms a falling wedge, targeting $1 post-breakout, per ZAYK Charts.
- AVAX also shows falling wedge, targeting $57 post-breakout, says ZAYK Charts.
- For AVAX, immediate support is observed at the lower boundary of the wedge.
Polygon (MATIC) and Avalanche (AVAX) are poised for significant bullish movements, according to recent analyses by veteran analyst ZAYK Charts. Observations indicate that both cryptocurrencies are forming falling wedge patterns on their daily (1D) charts, a setup typically indicative of a bullish reversal.
Polygon (MATIC) has been trading within a falling wedge pattern, characterized by lower highs and lower lows, suggesting a potential bullish reversal. The pattern indicates that the price is nearing the upper trendline, and a breakout above this level, supported by significant volume, could signal a strong bullish move.
Notably, the next target post-breakout is projected to be around $1. This level holds substantial psychological significance and aligns with historical resistance points. Immediate support is observed at the lower boundary of the wedge, with additional support around $0.430. Conversely, immediate resistance upon breakout will be at the $0.670 level, followed by the major resistance at $1.00.
Monitoring the volume during the breakout is crucial. Higher-than-average volume would validate the breakout and indicate a potential increase of around 82.69% from the current position to the $1 target.
Similarly, Avalanche (AVAX) is exhibiting a falling wedge pattern on its daily chart. The price action suggests that AVAX is approaching the upper boundary of the wedge. A confirmed breakout above this trendline, with substantial volume, could herald the beginning of a significant bullish trend.
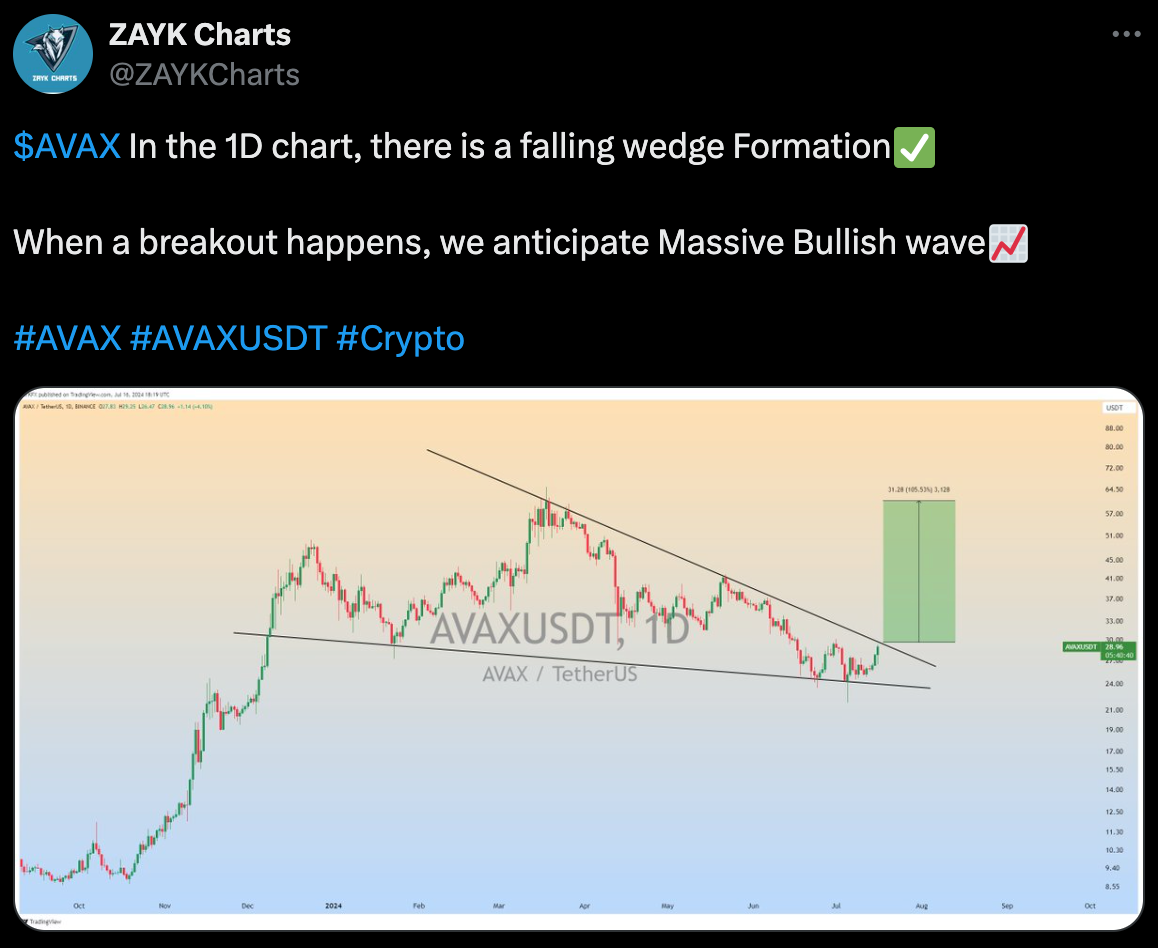
The target post-breakout is projected to be around $57, indicating a potential gain of approximately 105.53% from current levels. Immediate support is observed at the lower boundary of the wedge, with additional support levels around $23.88. Resistance upon breakout will first be at the upper boundary of the wedge, followed by the significant resistance level aligning with $57.
Volume plays a crucial role in confirming the breakout. A surge in volume during the breakout adds credibility to the signal and strengthens the bullish outlook.
AVAX vs. XLM: Which Coin Is Set to Dominate? Expert InsightsFor both MATIC and AVAX, the overall trend within the wedge has been bearish. However, recent price movements hint at potential reversals. Falling wedge patterns are generally bullish, suggesting that breakouts could lead to substantial upward price movements. Immediate support and resistance levels are critical to watch as they will guide traders in making informed decisions.