


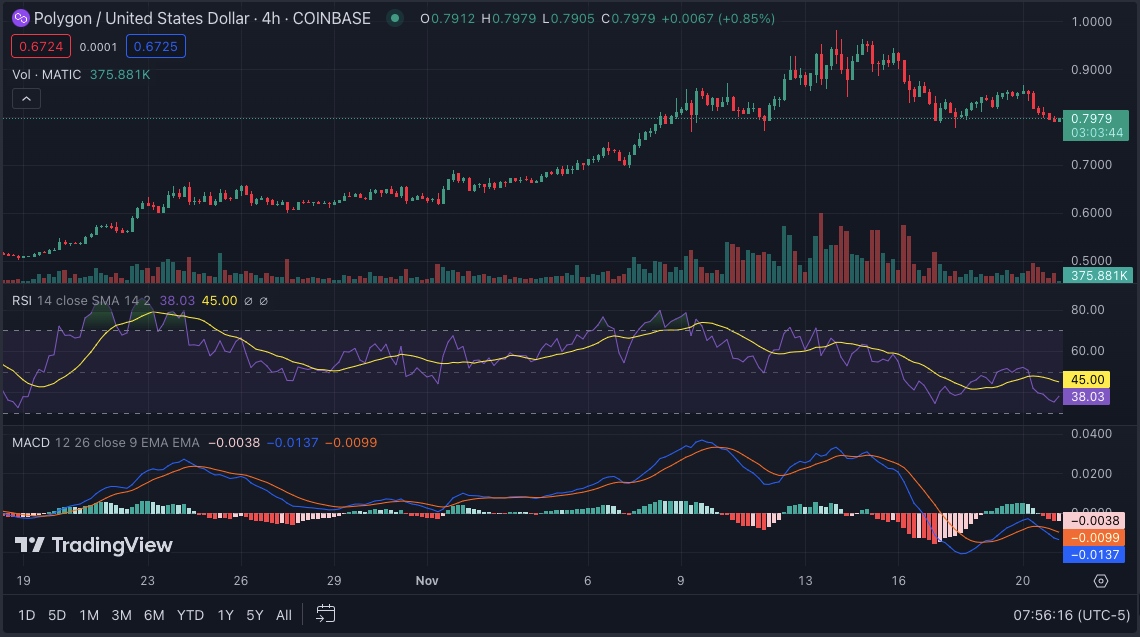
- Recent technical patterns in MATIC’s trading suggest a possible 16% price correction, with critical support at $0.79.
- Polygon’s MATIC observed a 9.5% decrease over the past week, reflecting broader cryptocurrency market trends.
- MATIC’s robust trading volume demonstrates continued investor interest and market engagement despite current fluctuations.
Polygon, a groundbreaking platform renowned for its efficient and user-friendly approach to enhancing Ethereum’s scalability and infrastructure, has been making waves in the cryptocurrency market. A recent analysis of MATIC, Polygon’s native token, reveals a notable pattern in its trading graph. Technical observers have pinpointed a head-and-shoulders formation on the 4-hour chart, a development that carries significant implications for future price movements.
A cryptocurrency analyst, Ali, shared a Twitter post providing insights on the current MATIC market.
#Polygon | It looks like $MATIC formed a head-and-shoulders on its 4-hour chart!
— Ali (@ali_charts) November 21, 2023
A sustained candlestick close below the pattern's neckline at $0.79 could trigger a 16% correction toward $0.67. Invalidation of the bearish outlook comes with an upswing above the right shoulder… pic.twitter.com/doA2ECdVtH
This technical formation suggests a potential downturn for MATIC if a consistent candlestick closure is observed below the pattern’s critical neckline, located at $0.79. Should this occur, market analysts anticipate a downward adjustment of approximately 16%, potentially bringing the price to around $0.67. A shift in market dynamics, characterized by a price surge above the right shoulder of the pattern, which currently stands at $0.86, could invalidate this bearish forecast.
Over the past seven days, MATIC has experienced a notable decrease in market value, losing approximately 15% of its worth. The bearish pressure has been attributed to a broad market downturn, with several other major cryptocurrencies also experiencing a decrease in value. However, the 24-hour trading volume of MATIC is a healthy $459 million, highlighting continued interest and activity from investors.
At the time of writing, the MATIC token is trading at $0.796, with a severe decrease of 6.49% in the last 24 hours. Despite this recent decline, experts remain optimistic about Polygon’s potential for growth and continued success. MATIC touched a high of $0.8553 earlier today before experiencing a slight pullback. The current market cap for MATIC is $7.36 billion, positioning it as the 14 largest cryptocurrency by market capitalization.
The hourly technical outlook for MATIC remains somewhat uncertain, with indicators suggesting mixed signals. The Relative Strength Index (RSI) has dipped below 50, indicating a potential oversold condition. The Moving Average Convergence/Divergence (MACD) also shows a bearish divergence between the signal and central lines, indicating a potential momentum shift toward the downside. However, the upper Bollinger Band currently provides resistance at $0.8695, indicating a potential price reversal.


