


- FET/USD holding crucial $0.46 support, setting the stage for a potential return to all-time highs.
- Japanese candlestick charts reveal price trends, with notable support and resistance levels.
- MACD and RSI indicators show a bearish trend and neutral momentum, guiding investor decisions.
Fetch.ai (FET), a prominent player in the cryptocurrency market, has been showcasing notable trends in its price movements. Recent data from Crypto Tony, an NFT Investor and Trader revealed the FET/USD pair holding a crucial support zone at $0.46, a significant indicator for investors and market analysts. This support level is critical as it lays the foundation for a potential push back to all-time highs (ATHs), a milestone avidly watched by the trading community.
$FET / $USD – Update
— Crypto Tony (@CryptoTony__) December 11, 2023
Hold 0.46c support zone we are retesting for that push back to ATHs. Been a good run so far and these pullbacks test the bulls strength as we run pic.twitter.com/EAiULnQVZX
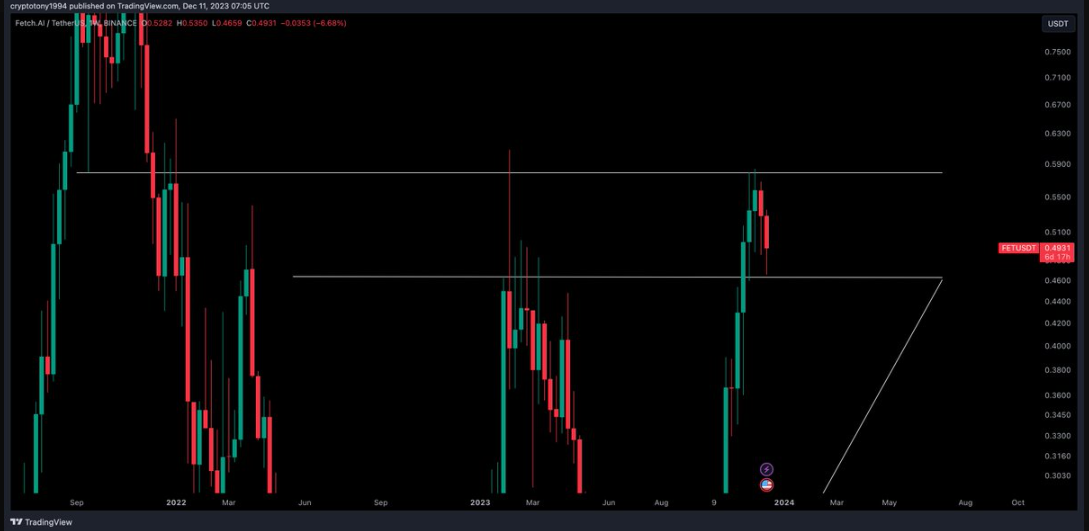
The historical price movement of FET, observed through Japanese candlestick charts, provides insightful details. These charts, covering the span of 2022 and extending into parts of 2023, with some projections into 2024, use red and green bars to represent price fluctuations over weekly periods. Green bars indicate a closing price higher than the opening, while red bars denote the opposite. This color coding simplifies the analysis of price trends over time.
Analyzing the chart further, one can notice significant horizontal lines indicating support and resistance levels. The upper line suggests a resistance level, a threshold challenging for the asset to surpass. Conversely, the lower line hints at a support level, where buying interest typically prevents further price decline. The presence of these lines is key in predicting future price behaviors.
A triangular pattern, emerging from the convergence of a horizontal and a diagonal trend line, has been identified. Such patterns typically signify market consolidation and often precede a significant price move upon breakout. The recent increase in the size of the candlesticks compared to previous periods highlights a surge in market volatility.
Currently, FET stands at $0.514266 with a 24-hour trading volume of $109,648,378.24. This reflects a 0.93% increase in the last 24 hours and an 8.24% decline over the past week. With a circulating supply of 1 billion FET, its market cap is valued at $528,020,554.
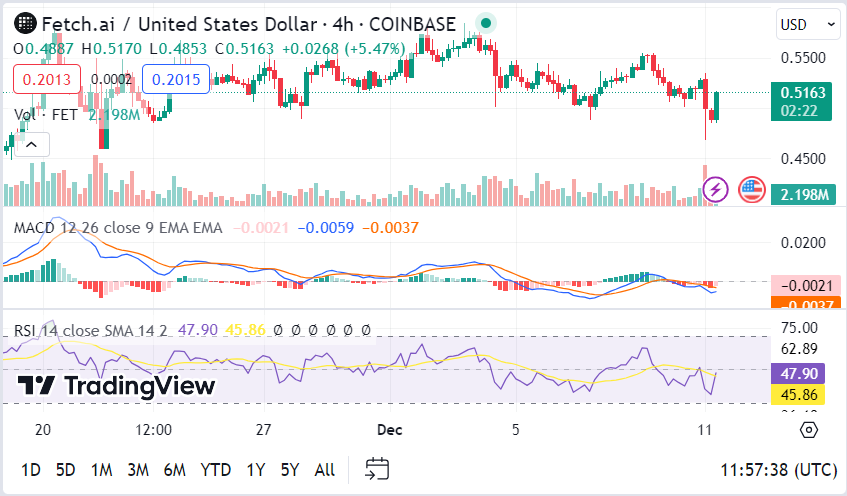
Two critical indicators, the MACD and RSI, provide additional insight. The MACD, comprising an orange and a blue line, currently shows a bearish trend with the MACD line below the signal line. The RSI, sitting at 47.90, indicates a neutral momentum, neither overbought nor oversold.
These analytical tools and indicators, combined with the observed patterns and trends, offer a comprehensive overview of FET’s market position. Investors and analysts alike closely monitor these factors to navigate the dynamic and often unpredictable cryptocurrency market.


