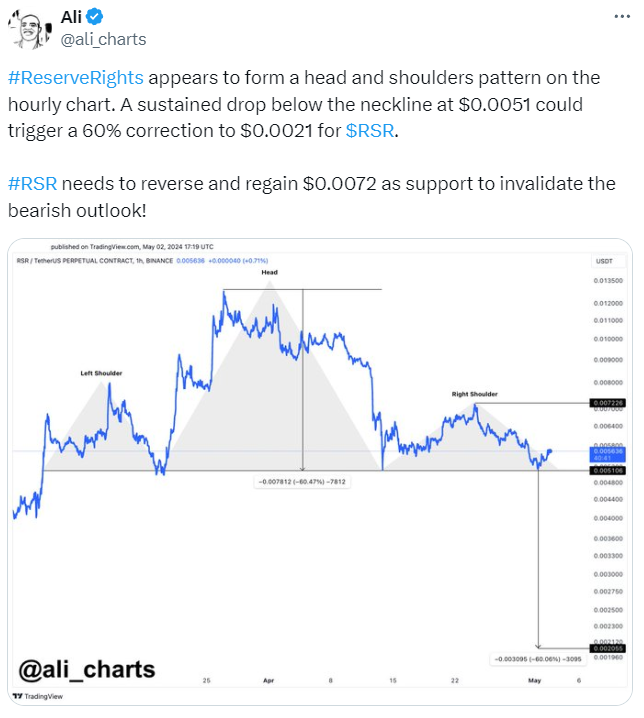
- The 1H chart of Reserve Rights (RSR) displays a bearish head and shoulder pattern.
- If RSR’s price sustains a fall below the $0.0051 neckline, it could trigger a significant 60% correction, dropping to $0.0021.
- Despite a 7.37% rise in daily trading, RSR still shows an 8.23% decline over the week.
Reserve Rights (RSR), a utility token using the Ethereum blockchain, has exhibited a notable pattern on its hourly trading chart. According to Ali Martinez’s recent post, the RSR token is currently undergoing a bearish trend moving alongside the Head and Shoulder pattern.

For RSR, the left shoulder formed in early April, followed by the head in mid-April, and the right shoulder by late April. Though the chart does not explicitly draw the neckline the analyst has identified a critical level at $0.0051.
If RSR’s price sustains a drop below the critical support level, the neckline at $0.0051, it could potentially trigger a 60% price correction, targeting a low of $0.0021. Conversely, a rise above $0.0072 would serve as a bullish signal, possibly invalidating the current pessimistic outlook.
At the time of press, RSR is trading at $0.005774 with a significant 24-hour trading volume of over $20 million. Despite a 7.37% increase in the last day, RSR has declined by 8.23% over the past week. This performance contrasts with the broader cryptocurrency market, which has decreased by 5.40%. In comparison to the Ethereum ecosystem cryptocurrencies which have gained an average of 12.70% RSR has significantly underperformed.
The head and shoulder pattern is one of the most common patterns that can be found on charts. It indicates the trend reversal pattern from a bullish to bearish market. Whether this will lead to a continued downturn or is merely a precursor to a more substantial price recovery remains to be seen, making RSR a significant point of focus in the cryptocurrency trading community.


