- XRP shows a buy signal on the TD Sequential, suggesting a potential rebound despite a recent 2.9% price drop.
- It’s crucial to monitor the yellow line on XRP’s weekly chart, as a break below it could indicate the emergence of significant buying zones.
- Mixed indicators like RSI, MACD, and KST on XRP imply cautious optimism for investors amid uncertain market conditions.
In the world of cryptocurrency, Ripple’s XRP continues to make waves, with recent technical analyses providing mixed signals and painting a complex picture of its future trajectory. According to Ali, a renowned blockchain figure, the TD Sequential indicator, a reliable tool for forecasting movements on the 3-day chart, currently shows a buy signal for XRP. This suggests a potential rebound for the digital asset.
As further highlighted by JD, a prominent cryptocurrency figure, market watchers should pay close attention to the yellow line on the weekly chart. A weekly candle close below this line could signal a descent to the orange box zone, where significant buying opportunities might emerge, regardless of whether the bottom has been reached.
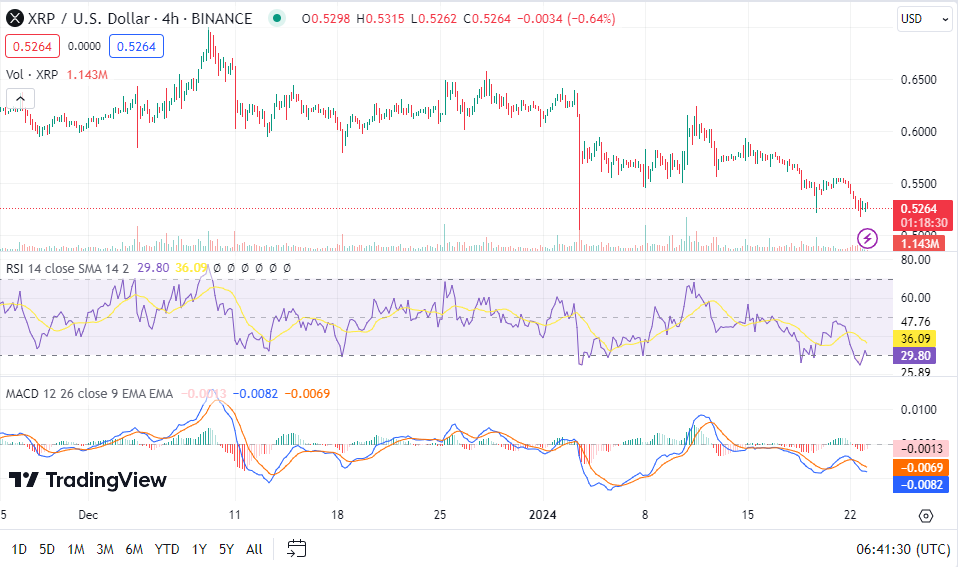
Notably, XRP’s price today is at $0.527445, reflecting a 2.90% decline over the last 24 hours, with its 24-hour trading volume reaching $1 billion. Despite this dip, the 4-hour Relative Strength Index (RSI) reads 29.80, indicating a neutral market position. This neutral stance suggests the absence of extreme overbought or oversold conditions.
On the flip side, the 4-hour Moving Average Convergence Divergence (MACD) points to a bearish trend, hinting at a possible continued price drop in the near term. Adding complexity to the analysis, the 4-hour Know Sure Thing (KST) indicator shows a slight positive momentum, hinting at a potential for upward price movements.

The market’s mixed signals underscore the importance of careful analysis for investors and traders. The RSI’s neutral position, coupled with the KST’s positive outlook, offers a glimmer of hope for an upward trend.
Yet, the bearish MACD cannot be overlooked, as it suggests a possible continuation of the recent price decline. Hence, investors are advised to monitor these indicators closely, especially the critical yellow line on the weekly chart.
Moreover, the anticipated introduction of XRP perpetual contracts on Gemini further adds to the intrigue. This development might influence XRP’s market dynamics, offering new avenues for investment and speculation.
Consequently, as the market navigates through these uncertain times, a blend of caution and optimism seems prudent. Ripple’s XRP, with its complex interplay of indicators, remains a fascinating subject for market analysts and investors alike.


