


- Shiba Inu faces strong resistance at $0.0000256, needing momentum to break through and target higher levels.
- A break below the $0.0000250 support could lead to further declines towards $0.0000248 if selling pressure rises.
- RSI at 50.70 suggests SHIB is neither overbought nor oversold, indicating potential for consolidation or sideways movement.
Shiba Inu (SHIB) is currently navigating a recovery phase alongside the broader cryptocurrency market. At press time, SHIB is priced at $0.00002489, with a market cap of $14.81 billion, positioning it as the 11th largest cryptocurrency. The 24-hour trading volume stands at $389.9 million, marking a 32.27% decrease, which suggests reduced trading activity. The circulating supply of SHIB is 589.27 trillion, close to its total supply of 589.52 trillion.
Over the past 24 hours, SHIB’s price has experienced fluctuations, with a downward trend oscillating between $0.00002563 and $0.0000248. The price has declined by 1.89% during this period.
The immediate support level at $0.0000250 has been tested multiple times, indicating that buyers are stepping in to prevent further declines. A more substantial support level at $0.0000248 has also shown resilience, suggesting a strong buyer interest at this price.
The short-term resistance at $0.0000256, which is the highest point in the recent 24-hour period, has been tested but not surpassed. Another resistance level at $0.0000253 has similarly posed challenges, with the price failing to sustain above this level.
Market dynamics reveal a volume-to-market cap ratio of 2.63%, indicating moderate trading activity relative to the total market capitalization. The overall trend for the past day is slightly bearish, with lower highs and lower lows indicating selling pressure. SHIB has struggled to maintain levels above $0.0000253, reflecting difficulty in breaking out upwards.
Shiba Inu Whale Awakens with Massive Transactions: A Bullish Move?If SHIB can gain upward momentum and break past the resistance at $0.0000256, it could target higher levels, potentially approaching $0.0000260. Sustained volume and broader market support would be crucial for this bullish scenario. Conversely, a break below the immediate support of $0.0000250 could lead to further declines towards $0.0000248 and potentially lower if selling pressure intensifies.
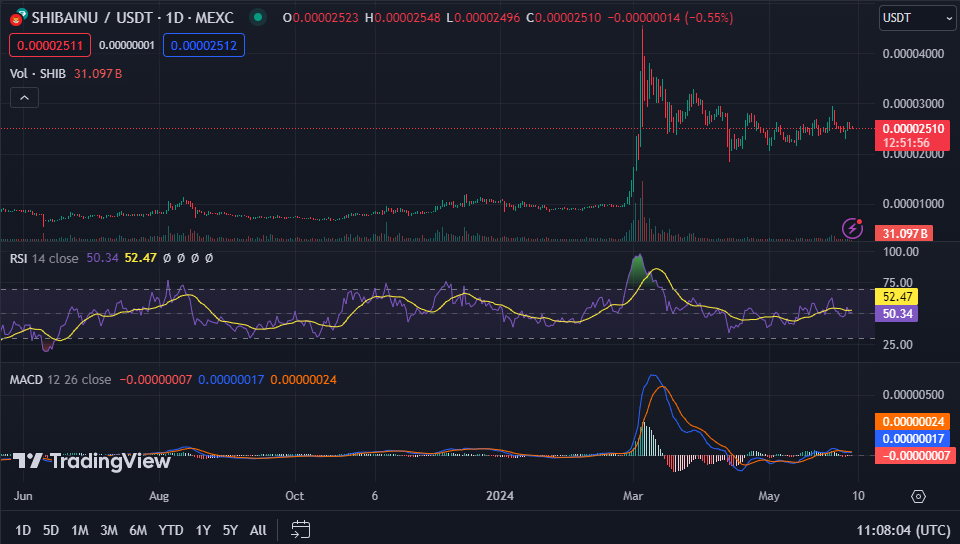
The 1-day Relative Strength Index (RSI) for SHIB reads 50.70, indicating that the cryptocurrency is neither overbought nor oversold. This suggests a potential period of consolidation or sideways movement in the near future. Additionally, the 1-day Moving Average Convergence Divergence (MACD) trading below the signal line, reading 0.00000017, could indicate a bearish trend forming.


