


- Historical trends suggest Bitcoin’s ATHs are followed by corrections and long consolidation periods.
- Key support levels are $20,000 and $60,000, with a breakout above $60,000 projected to lead to a new ATH.
- Recent market data indicates a potential local bottom, with a healthier balance in the futures market and near-zero funding rates.
Bitcoin has been a topic of intense scrutiny and speculation, especially when analyzing its price movements from 2013 to 2024. As per analysis by Mags, an analyst, historical patterns suggest that Bitcoin’s all-time highs (ATH) are typically followed by significant corrections and prolonged periods of sideways movement.

For instance, the ATH in 2013 was succeeded by a notable correction and an extended phase of lateral movement. This consolidation period eventually led to a breakout, culminating in a new ATH in 2017.
From 2017 to 2020, Bitcoin’s price mirrored this pattern. After reaching an ATH in 2017, the cryptocurrency experienced another phase of sideways movement and consolidation. This pattern persisted until 2020 when a breakout from the consolidation phase occurred, pushing Bitcoin to another ATH.
Observing the price trend after the 2020 ATH, a similar pattern of sideways movement is evident. The projection for 2024 suggests a potential breakout from the current consolidation phase, possibly leading to another ATH.
Bitcoin Drops Below $62K Amidst Mixed Trends in Top CryptosKey support and resistance levels play a crucial role in Bitcoin’s price movements. Historically, the $20,000 mark, which was the ATH in 2017, has served as a significant support level.
Similarly, the $60,000 mark, corresponding to the 2020 ATH, also acts as a critical support level. On the resistance front, the $60,000 mark is noteworthy. A breakout above this resistance level is projected to lead to a new ATH.
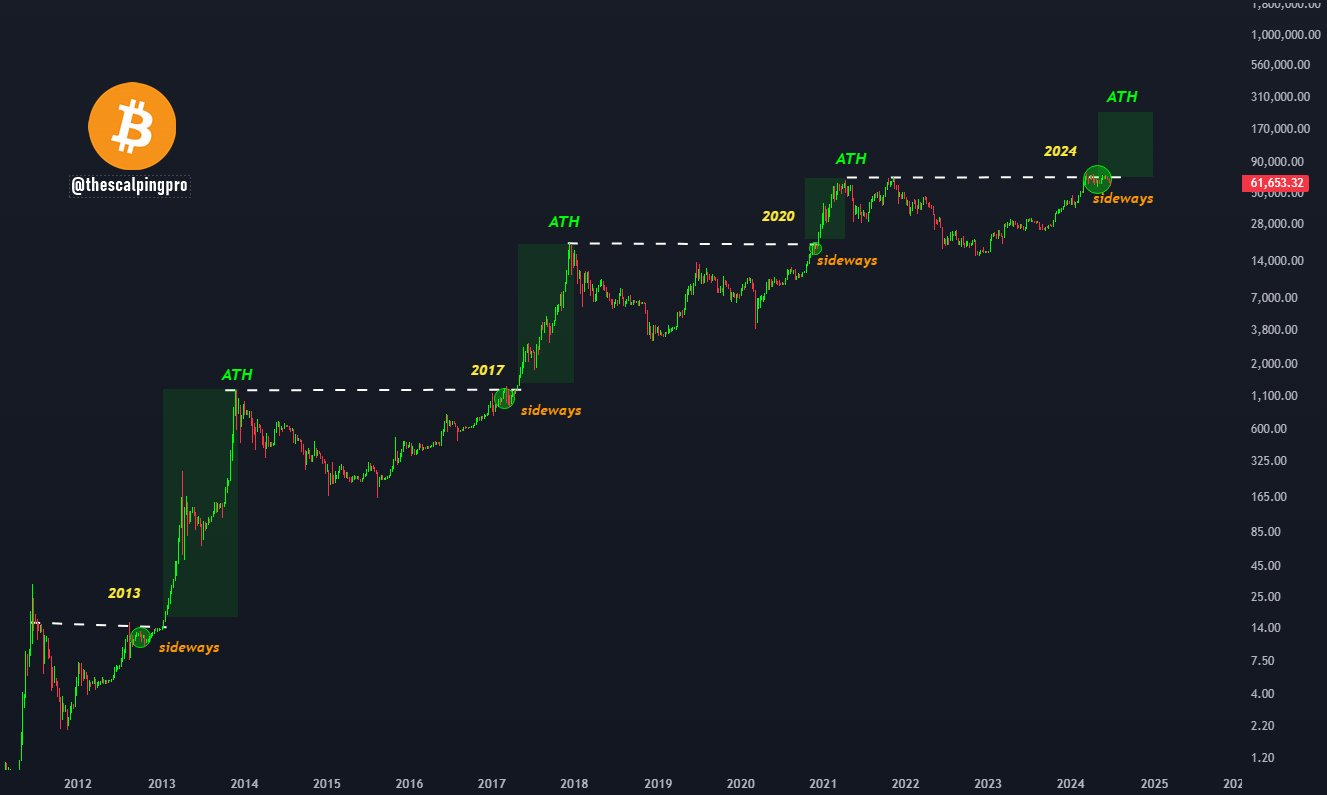
The projected price target for this new ATH in 2024 appears significantly higher. The pattern suggests that after reaching this new ATH, Bitcoin may enter another period of sideways movement.
As further noted by CryptoQuant, an On-chain analytic firm, recent market activity shows signs of a potential local bottom following a 15% correction. Bitcoin’s price declined from the $70,000 range to the $60,000 range over the past three weeks.


