


- Solana surpassed BNB in terms of market cap on Friday, securing 4th position among crypto currencies.
- Speculation about SOL ETFs fuels bullish momentum, with predictions of continued ecosystem growth driving investor interest.
- Despite Solana’s price rise, decreased trading volume hints at potential consolidation before further price movements.
Solana (SOL) has defeated Binance Coin (BNB) to secure the #4 spot in the cryptocurrency rankings for the first time in about 4 years. This milestone highlights Solana’s impressive growth and the increasing confidence in its technology and ecosystem. As highlighted by Santiment, a top analytic firm, over the past two weeks, Solana’s price has risen by a remarkable 35%, outpacing Binance Coin’s 10% gain.

One significant factor driving Solana’s recent price surge is the circulating rumors within the crypto community about potential SOL ETFs. Following the approval of Bitcoin and Ethereum ETFs, speculation is rife that Solana could be next in line. This prospect has fueled investor enthusiasm, contributing to the bullish sentiment surrounding Solana. But accosring to BlackRock crypto chiefs view point there are only “Slim Chance” for SOL ETFs.
Analysts are increasingly optimistic about Solana’s price potential. Notably, analyst Ali has set a bold price target of $1,000 for SOL, drawing parallels to its significant price pump in 2021.
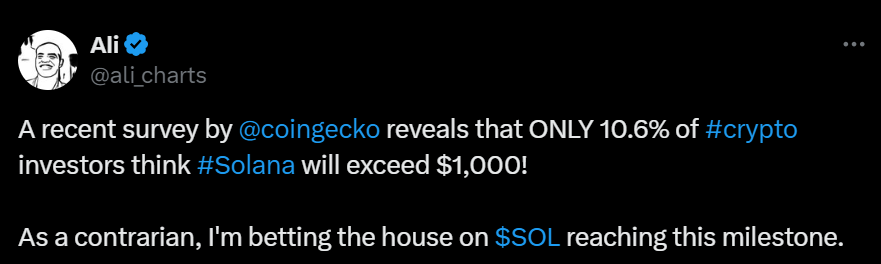
While this prediction is highly bullish, it is based on the assumption that Solana will continue to expand its market share and ecosystem. The growing adoption of Solana’s technology and its robust ecosystem support this optimistic outlook.
Analyzing Solana’s recent price trend reveals a strong upward trajectory. Over the past day, Solana’s price has increased by 3.83%, reaching $183, at press time.
Solana Market Trends: Will a Short-Squeeze Propel SOL?However, trading volume has decreased by 31.14%, suggesting reduced trading activity despite the price increase. This divergence could indicate a potential consolidation phase before the next major price movement.
Currently, the $177 level serves as a significant support, having previously acted as a buying zone before the recent uptrend. On the resistance side, $184 is a short-term barrier that Solana has recently tested.
A break above this level could signal further bullish momentum. Additionally, the $182 level, which previously acted as resistance multiple times, has been surpassed, indicating strong buying interest and bullish sentiment.
As per DefiLlama data, the Total Value Locked (TVL) in the Solana ecosystem stands at $5.472 billion, reflecting substantial investor confidence. It has recently emerged as the third largest network trailing behind Ethereum and Tron. Daily fees and revenue of $1.63 million and $812,748, respectively, highlight strong transactional activity on the network.

Solana’s 1-day Relative Strength Index (RSI) reads 62.29, indicating a neutral position, neither overbought nor oversold. However, the 1-day Moving Average Convergence Divergence (MACD) trading below the signal line suggests potential short-term downward momentum.


