


- SOL’s price at $65.87 signals a 6.54% decline in 24 hours, contrasting a week’s 4.30% rise, highlighting market volatility.
- With SOL above key support, a breakout above $78 could lead to $90-$107, while falling below could retest $58, showing critical levels.
- Stable trading volume and neutral RSI at 46.36 suggest a balanced market; MACD indicates bearish trend, urging cautious investment.
In the dynamic world of cryptocurrency, Solana (SOL) has recently drawn attention due to its fluctuating price and trading patterns. As of today, SOL is priced at $65.87, with a notable 24-hour trading volume of $2 billion. This price marks a decrease of 6.54% in the last day, contrasting with a 4.30% increase over the past week. Solana’s market cap currently stands at $28 billion, backed by a circulating supply of 430 million SOL.
Analyzing Solana’s price movement reveals that it’s hovering above a crucial support line. Historically, the price has consistently bounced off this line, indicating a potential opportunity for investors. However, caution is advised as, in the event of a market downturn, this support could fail, leading to a further decline in price.
As per CryptoBusy, an analytics platorm, investors and traders are keenly observing the $78 mark, as a breakout above this level could signal an upward trend, potentially reaching resistance levels at $90 and then $107. Conversely, a breakdown below the key support level might see the price retesting the $58 mark.
#Solana Update:
— CryptoBusy (@CryptoBusy) December 12, 2023
The price of $SOL is near the key level support again.
Based on the historical data, the price keeps bouncing from this support line.
But don’t just immediately go long, if the market wants a sell-off, it could still break down from this line.
My strategy:… https://t.co/Sl4eJET06y pic.twitter.com/svS8RshHKg
The Moving Average Convergence Divergence (MACD) provides further insight into Solana’s market behavior. The MACD, a tool used to identify potential buy and sell signals, shows a bearish trend with the MACD line (blue) crossing below the signal line (orange). Additionally, the histogram, which helps visualize the difference between the MACD line and the signal line, further supports this bearish outlook, as it is currently below the zero line.
The Relative Strength Index (RSI), another critical indicator, presents a neutral stance with a value of around 46.36. The RSI measures the magnitude of recent price changes to evaluate overbought or oversold conditions. An RSI value below 30 typically suggests an oversold market, while above 70 indicates overbought conditions. Solana’s current RSI suggests neither, positioning it in a neutral zone.
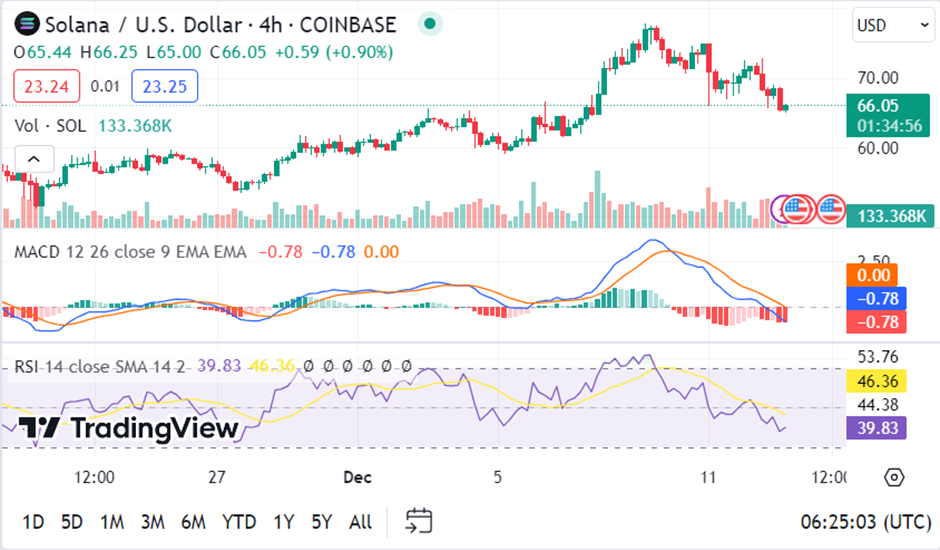
Moreover, examining the trading volume, which reflects the number of shares traded in each period, reveals no significant spikes or unusual trading activity. This consistent volume pattern suggests a stable trading environment without any extraordinary market movements.
Consequently, while the prospect of investing in Solana might seem enticing due to its historical support bounces, it’s essential to proceed with caution. Market trends, especially in the volatile world of cryptocurrencies, can swiftly change. Investors should seek confirmation of a trend reversal or breakout before making any decisions, keeping an eye on key indicators like the MACD and RSI for additional guidance.


