

- Solana’s upward trend since November 2023 faces a corrective phase, with key support at $126 and resistance around $170.
- Support at $143 has proven strong, while resistance near $166 could challenge Solana’s short-term upward momentum.
- A break above $166 could signal a bullish reversal, but a drop below $143 might indicate a bearish shift.
Solana (SOL) continues to impress market observers as it maintains a strong upward trend. Since bottoming out in November 2023, SOL has been steadily climbing, with analysts noting a series of higher highs and higher lows, culminating in a peak at wave (iii).
Crypto Tony, a top analyst, has presented a chart indicating Solana’s price movements and the potential uptick. Solana’s price action has been moving sideways with occasional dips, characteristic of a wave (iv) correction in Elliott Wave theory.
On the weekly chart, key levels have emerged, providing crucial insights into Solana’s price movements. A horizontal support line around the $126 price level has been identified, marking a zone of significant buying interest. This level has been tested multiple times, most notably when the price dipped recently, only to rebound quickly. This behavior suggests that buyers are eager to accumulate at this level, reinforcing it as a solid foundation for Solana’s price.

In contrast, resistance levels present potential hurdles for further price appreciation. Near-term resistance is spotted in the range of $170, a level that has repeatedly rejected upward price action in the past. A more formidable resistance lies around $245, the previous high of wave (iii). A successful breach of this level would likely signal the commencement of wave (v), potentially propelling Solana’s price even higher.
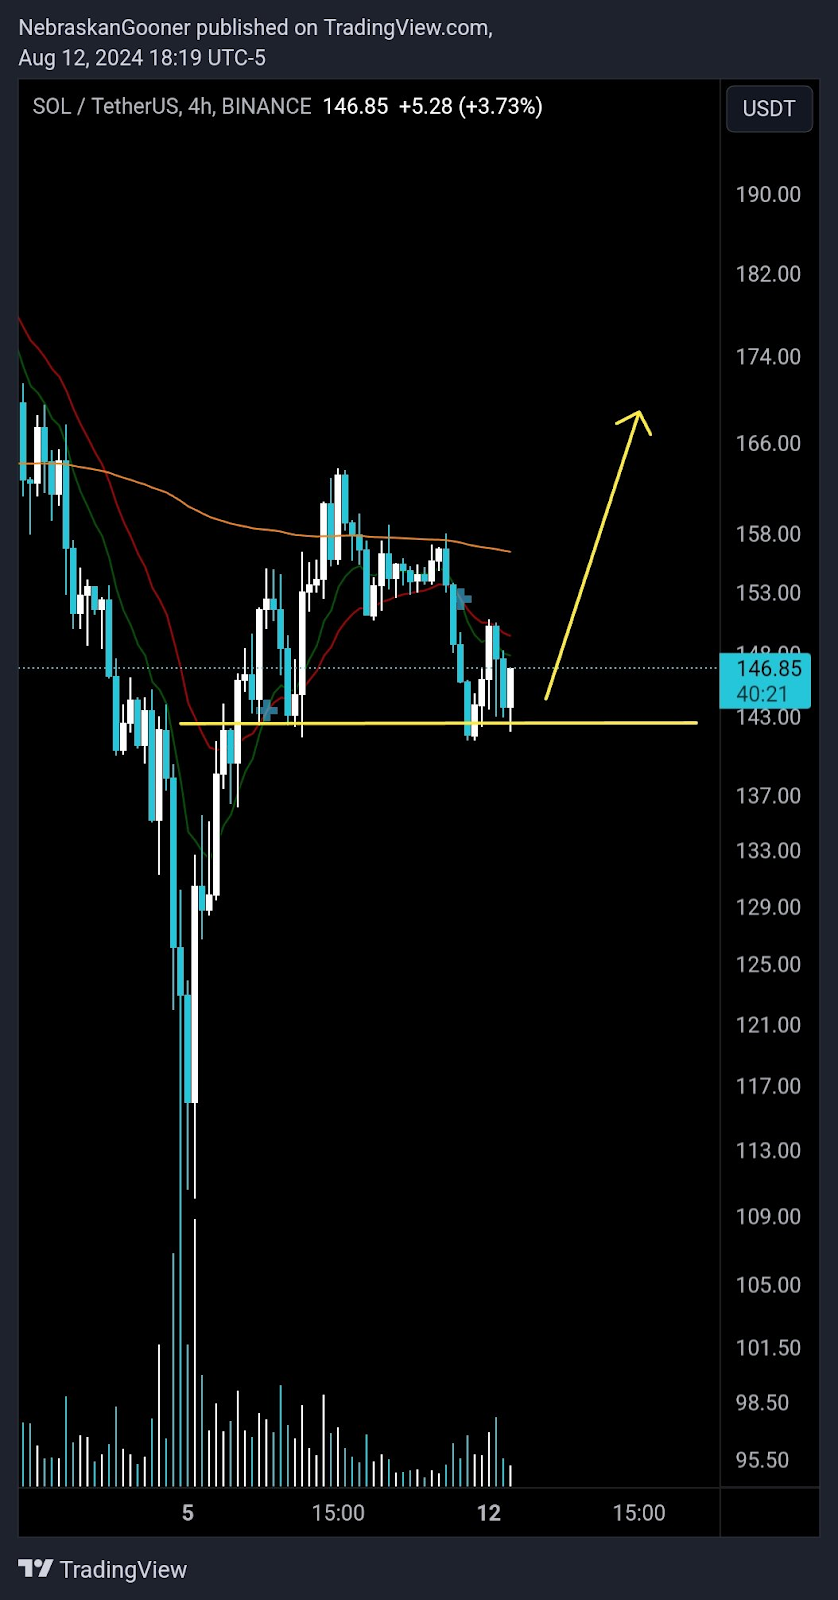
Turning to the 4-hour SOL/USDT chart, the current trend appears to be recovering from a recent dip, with Solana trading near the $146.85 mark. Further analysis by Nebraskangooner shows that the short-term trend indicates consolidation, with a slight upward bias.
A key support level at approximately $143 has been tested several times, acting as a reliable base for price rebounds. This suggests that buyers remain interested at this price point, lending credence to the level’s importance.
Solana Poised for Growth, Crypto Analyst Forecasts UptrendResistance levels on this chart are seen around $166, where the price has previously struggled to break above. This area might challenge Solana’s ability to maintain its upward trajectory. Moving averages on the chart further clarify the price trend. The crossing above the shorter-term moving average signals a bullish trend, while interactions with the longer-term moving average will likely confirm the strength of the upward movement.
If the price breaks above the $166 resistance with significant volume, it could confirm a bullish reversal, pointing towards a continuation of the upward trend. Conversely, a drop below the $143 support could indicate a potential bearish phase. With Solana at press time priced at $145.67 and up 1.41% in the last 24 hours, market participants will closely watch these levels to gauge future price action.