


- Solana’s breakout from the bullish pennant hints at a potential 900% rally, with $1,448 as a long-term target.
- Key resistance at $184 needs to be breached for a breakout, with $265 and $650 as next targets if momentum persists.
- Despite a 1.79% drop, Solana’s RSI at 57.80 and MACD above the signal line suggest bullish momentum.
Solana ($SOL) has recently made headlines with a significant technical breakout from a bullish pennant pattern, hinting at a potentially massive rally ahead. This breakout, observed on Solana’s weekly price chart against the US Dollar (USD) on Coinbase, suggests a compelling bullish trend. Ali Martinez, an analyst, is eyeing a potential 900% increase, reflecting the market’s high expectations.
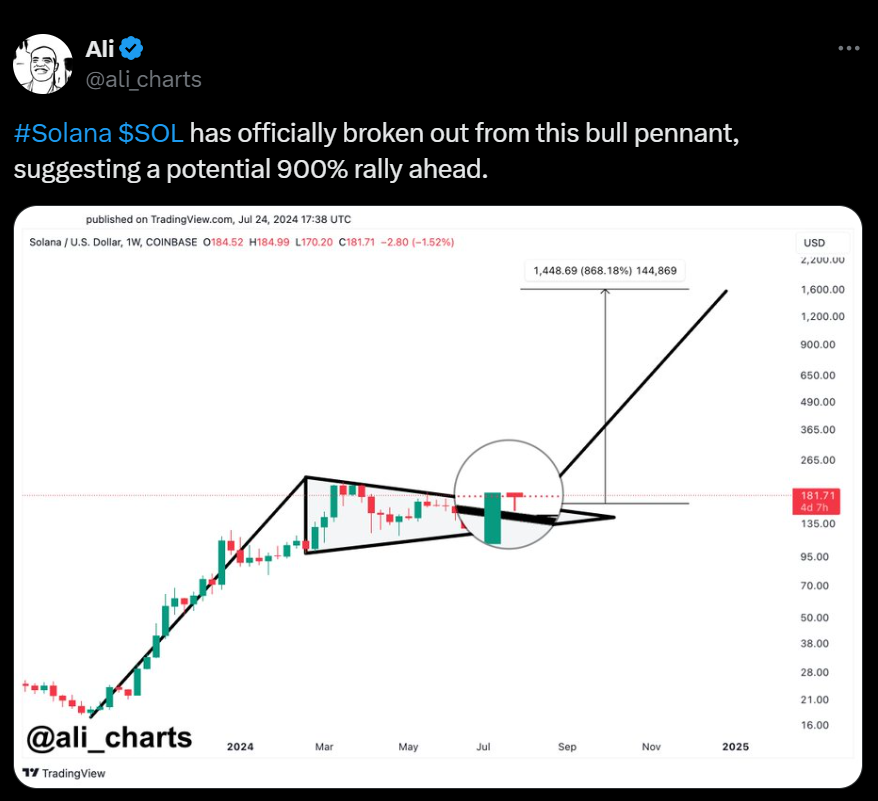
The bullish pennant pattern begins with a sharp upward movement, creating what is known as the flagpole. This initial surge signifies strong bullish momentum. Following this, the price enters a consolidation phase, forming the pennant. During this period, the price experiences lower highs and higher lows, resulting in converging trendlines. This consolidation phase typically signals a pause before a potential continuation of the upward trend upon a breakout.
Currently, Solana’s price trend shows several key levels that could influence its future movements. The $135 level, forming the lower boundary of the pennant, has been a significant support point. This level has been tested multiple times, proving its strength as a base for price consolidation. Additionally, the $170 level serves as an intermediate support, where buyers have stepped in before the price approached the lower boundary.
On the resistance front, the $184 level stands out as a critical hurdle. This resistance level, marked by the recent high within the pennant, needs to be surpassed to confirm a breakout.
Should the price breach this resistance, the next target could be around $265. This level represents the initial target based on the height of the pennant added to the breakout point.
Solana’s Bullish Pennant: Here’s Why $153 to $160 Support is CriticalFurthermore, a significant resistance level is projected at $650, derived from the measured move of the flagpole. This target could be reached if the price maintains the breakout momentum.
The measured move projection from the breakout indicates a potential target of approximately $1,448. This represents an 868.18% increase from the breakout point, underscoring the potential for substantial gains.
Solana’s price stands at $170.20, with a 24-hour trading volume of $3,930,349,885. Despite a 1.79% decline in the last 24 hours, the 1-day Relative Strength Index (RSI) at 57.80 suggests that Solana is neither overbought nor oversold.
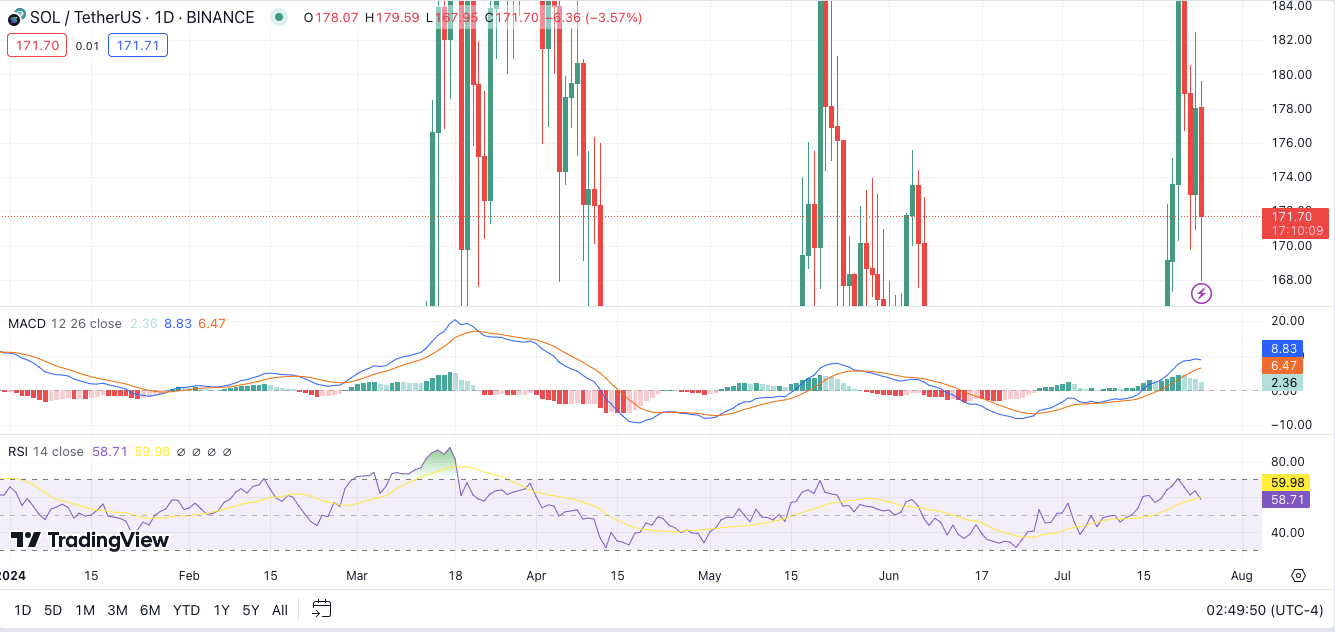
Additionally, the 1-day Moving Average Convergence Divergence (MACD) trading above the signal line hints at emerging bullish momentum.


