


- Solana’s value demonstrates notable volatility, with the potential for extreme highs and low points.
- Despite a recent decrease, SOL’s trading volume shows an upward trend, indicating growing market interest.
- Technical indicators suggest a bearish outlook for Solana, with signs of increased selling pressure.
The recent developments in Solana’s SOL cryptocurrency have caught the attention of investors, as it exhibits a notable ‘Head and Shoulders’ pattern. This technical chart pattern is renowned for its reliability, boasting an impressive 81% accuracy rate in predicting market movements. However, it’s crucial for traders not to rely solely on this pattern.
Crypto analysts and educators known on Twitter as CryptoBusy shared a post providing insights on the current performance of SOL:
#Solana $SOL Head and Shoulders Pattern! Should you worry?
— CryptoBusy (@CryptoBusy) November 21, 2023
Though this pattern has an 81% success rate, don’t trade based on chart patterns alone.
Always use basic support and resistance levels, follow what the indicators are saying, and ride the trend! pic.twitter.com/158qDjXuFa
Expert advice suggests that incorporating fundamental trading strategies is key. This includes focusing on essential support and resistance levels as critical markers for potential price reversals or continuations. Additionally, monitoring various indicators can provide deeper insights into market sentiment and potential shifts.
Solana’s (SOL) recent market movements have been the subject of much analysis and speculation in the cryptocurrency community. The digital currency has seen a gradual pullback, notably falling below significant levels at $61 and $53. These price points have previously acted as pivotal rejection levels, signaling potential shifts in market dynamics. As the market approaches the monthly close, breaching the crucial red horizontal support level could indicate a more substantial retracement in Solana‘s value.
Rekt Capital, a prominent crypto analyst and trader, shared a Twitter post highlighting Solana’s recent price movements and pondering whether history will repeat itself in the cryptocurrency’s journey.
$SOL
— Rekt Capital (@rektcapital) November 21, 2023
Slowly pulling back, losing the $61 and $53 levels (key levels of rejection in the past)
Let’s see how things develop heading into the Monthly Close but losing the red horizontal level as support could spell deeper retracement#SOL #Crypto #Solana https://t.co/4N8JDrnbvt pic.twitter.com/BEno4j3i5h
Despite this pullback, Solana has demonstrated a remarkable rally, consistently reaching higher values. It has recently touched the resistance level of $53, a significant marker established back in 2021. This milestone has sparked discussions about whether Solana can extend its rally to the $61 mark, a key level it achieved in the past.
The journey of Solana has been characterized by its strong performance, consistently outshining others in the market. In 2021, the cryptocurrency notably deviated upwards to $53 and then to $61, only to retrace back to the lower bounds of what is now termed the ‘purple box’ in trading circles. This historical perspective raises questions about the potential repetition of such patterns.
A closer look at Solana’s trajectory suggests the possibility of extreme volatility in its value. On the one hand, there’s potential for an upward surge beyond approximately $42.86, marked by the red line. Conversely, a strong rejection could also lead to a significant downturn, potentially driving prices as low as $30, below the established purple box threshold.
Over the past few days, the SOL token has seen a bearish pattern from a weekly high of $67.00, and since then, it has been on a downward trend. SOL has seen a strong decrease of about 7% over the past week, with sellers taking over and pushing prices towards the crucial support levels. Currently, SOL is at $54.90, with a dip of 1.48% in the last 24 hours. However, the trading volume has seen an uptick of 29% in the past 24 hours at $2.5 billion, indicating growing interest and activity in the SOL market.
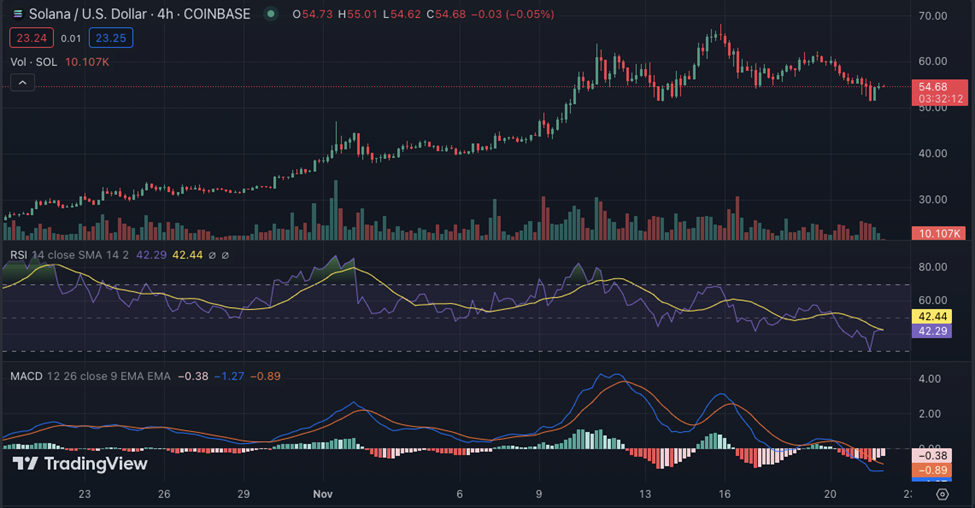
The four-hour technical indicators suggest a significant bearish trend, with the Relative Strength Index (RSI) falling below 50. This signifies increased selling pressure and potential further downward movement in Solana’s value. The Moving Average Convergence Divergence (MACD) has also shown a slight bearish crossover, with the MACD line (blue) crossing below the Signal line (orange), indicating a potential downtrend. The 20-EMA is currently below the 50-EMA, further confirming the bearish outlook in Solana’s market.


