- ETH approaches crucial support near $3,360 ahead of ETFs, indicating a potential pivotal moment for investors.
- Breaking above the $3,660 resistance could trigger a bullish move toward $4,095 and possibly the $4,868 all-time high.
- A drop below the long-term trendline risks deeper corrections to $3,050 or $2,650, highlighting critical support levels.
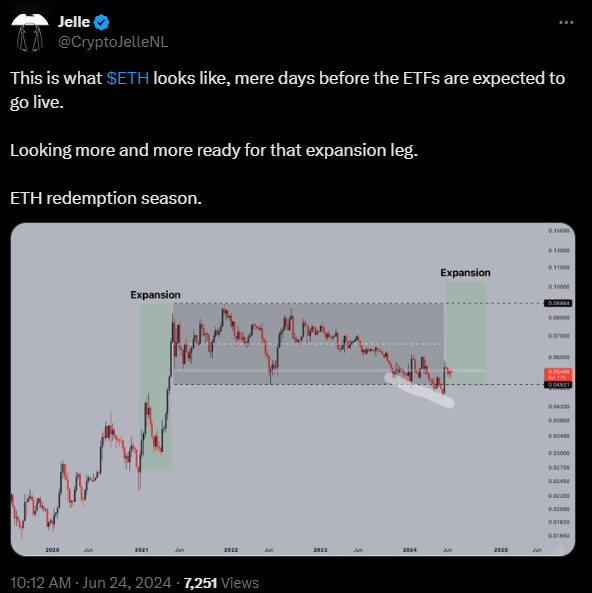
Ethereum is currently at a crucial juncture, just days before the anticipated launch of several ETFs, as highlighted by Jelle, a top analyst. The cryptocurrency, trading at approximately $3,360, is edging closer to a significant support level, suggesting a possible pivotal moment for traders and investors. The current price action indicates that ETH might be gearing up for another expansion leg, bolstered by a key trendline and multiple support and resistance levels.

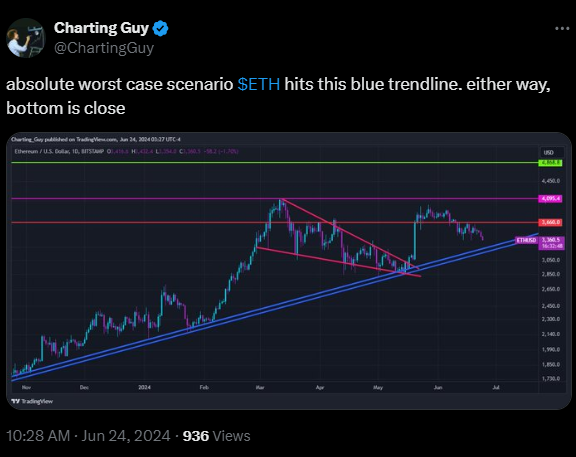
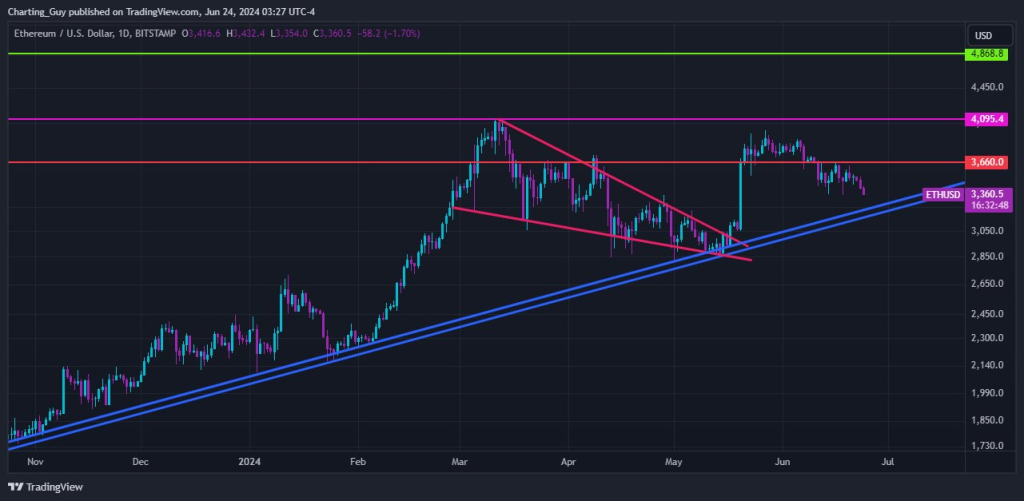
As further noted by Charting Guy, an analyst, the long-term ascending trendline, depicted in blue on the chart, has consistently supported ETH. This trendline has been tested multiple times, with each test resulting in a bounce-back, indicating strong buyer interest. As the price nears this line again, the bulls must defend this level to maintain the uptrend.

Besides the trendline, ETH is forming a symmetrical triangle pattern, which typically suggests a period of consolidation before a breakout. In early May, ETH broke out of this pattern to the upside, continuing its bullish trajectory. This breakout underscores the bullish sentiment in the market, yet the journey ahead is marked by several critical resistance levels.
Ethereum’s Major Milestones and Their Impact on Market DynamicsOne such level is at $3,660, a point where the price has encountered significant selling pressure. If ETH can break and sustain above this level, it could pave the way for a retest of the $4,095 resistance. This level, marked by a magenta line, was previously tested in early March but failed to hold, leading to a subsequent pullback. Overcoming this resistance would be a bullish signal, potentially setting the stage for a move towards the all-time high of $4,868.

Source: Charting Guy
However, a deeper correction might be on the horizon if the price fails to hold above the long-term trendline. Key support levels to watch in this scenario include $3,050, which lies near the trendline, and $2,650, a historically significant support level that has provided a floor during past downturns.
The current market dynamics are further complicated by a recent 3.69% decline in ETH’s price over the last 24 hours. This drop has brought ETH’s price to $3,307.35 at press time, with a 24-hour trading volume of $13,210,199,287.


