


- Immediate resistance at $3,726.4 must be surpassed for Ethereum’s bullish trend to continue.
- Ethereum’s major resistance between $4,528.0 and $4,534.6 signals strong bullish momentum if breached.
- Crucial support at $3,168.1-$3,084.8 must hold to prevent a bearish trend for Ethereum.
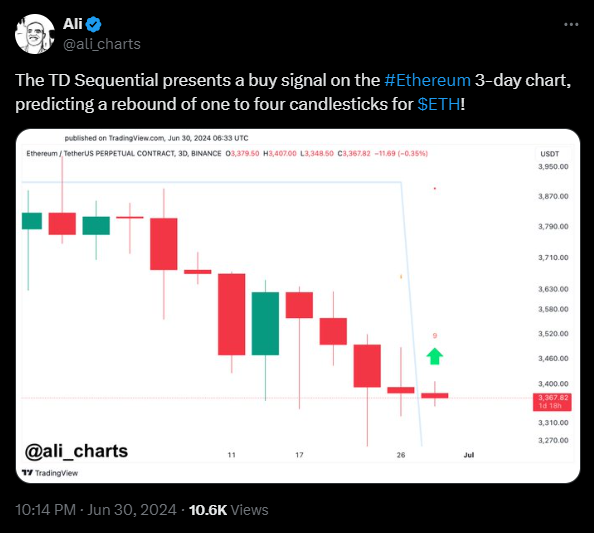
Ethereum (ETH) has shown a promising buy signal on the 3-day chart according to the TD Sequential indicator as highlighted by Ali Martinez, a top analyst. This suggests a potential rebound spanning one to four candlesticks.
VeLLa Crypto, an analyst, forecast is creating excitement among investors, with many anticipating a new all-time high (ATH) for Ethereum. Immediate resistance for Ethereum lies at $3,726.4. For the price to move higher, it must break and sustain above this level. This level is crucial as it acts as a significant hurdle. Consequently, surpassing it could pave the way for further upward movement.

Beyond the immediate resistance, a major resistance zone exists between $4,528.0 and $4,534.6. Breaking above this zone would indicate strong bullish momentum. This range marks a significant area where the price could face challenges, but overcoming it could signal a substantial upward trend.
On the downside, immediate support is found at $3,462.7. Ethereum’s price is currently testing this level. If this support holds, it could serve as a foundation for the next upward move. However, if it fails, the price might seek additional support at $3,344.8. This secondary support level provides an additional cushion in case the price breaks below the immediate support.
Ethereum ETF Revolution: SEC Approvals, ARK Invest’s Exit, and Market DynamicsMoreover, a major support zone lies between $3,168.1 and $3,084.8. This zone is crucial as falling below it could indicate a bearish trend. Therefore, maintaining above this level is essential for Ethereum’s continued upward momentum.
The trend analysis indicates that Ethereum’s price has experienced a peak followed by a pullback. Currently, it is attempting to consolidate and move upwards. The green highlighted area above $3,726.4 suggests a potential target zone if the price breaks above this resistance. Conversely, the red highlighted area below $3,462.7 indicates a risk zone where the price might find support. However, breaching this level could signal further downside risks.
The red line in the chart represents a moving average, likely the 200-period moving average, acting as dynamic support. This moving average is significant as it often serves as a trend indicator. Staying above this moving average could further validate the bullish outlook.
At present, Ethereum’s live price stands at $3,483.14, marking a 3.65% increase over the last 24 hours with a trading volume of $10,257,455,406.


