- TD Sequential has consistently forecasted MATIC’s price, underscoring its reliability for short-term trading strategies.
- Recent trading patterns highlight the importance of the $0.92 support level for MATIC, suggesting a pivotal moment for investors.
- Volatility in MATIC’s price offers both risks and rewards, emphasizing the need for careful analysis before trading.
Polygon (MATIC), an Ethereum scaling solution, has recently been the subject of keen observation by Ali, a well-regarded crypto analyst. Analyst Ali has successfully utilized the TD Sequential indicator to forecast MATIC’s price movements since mid-February, with remarkable accuracy on the 4-hour trading charts. Presently, this indicator has illuminated a buying signal, suggesting that MATIC is primed for a rally from its $0.92 support level.
The trading activity of MATIC’s token, as illustrated in recent charts, paints a picture of its volatile trajectory. This volatility is marked by pronounced fluctuations, with green and red digits symbolizing potential buy and sell points as per the technical analysis.
The journey began with an initial setback, where the token’s value dipped by nearly 7%, only to recover shortly after that. Another decline followed this time by a steeper 11.13%, setting the stage for a roller-coaster of price movements. The most notable uplift was observed at the ninth point, enhancing the value by 5.28%. Yet, this peak was transient, succumbing to a 7.59% decrease, underscoring the erratic nature of the crypto market.
The expert’s analysis showcases MATIC’s token enduring significant price swings, highlighted by its recent interactions with the $0.92 support threshold. This activity suggests that the token is at a critical juncture, potentially leading to a significant rebound if the current buy signal materializes as predicted.
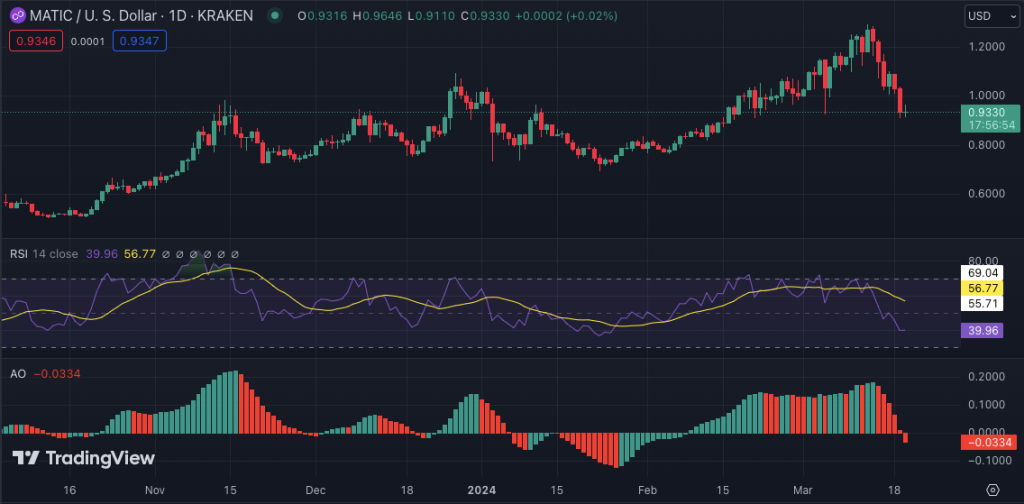
Over the past 24 hours, Polygon has seen its value dip by 3.65%. At the time of press, the digital currency trades at $0.9297. The market capitalization has slightly retracted to $9,290,890,373. This places Polygon at the 16th position in market rank. Notably, trading activity surged, with volume increasing by 38.77% to reach $752 million. This volume accounts for 8.30% of the market cap.

MATIC/USD Daily Price Chart: Tradingview
The technical indicators for the token provide mixed signals. The Relative Strength Index (RSI) rests at 39.96, reflecting neither overbought nor oversold conditions. Meanwhile, the Awesome Oscillator (AO) shows a slight negative momentum at -0.0334. These metrics suggest a period of consolidation in the current trading range.


