


- TD Sequential indicator flashing sell signal on Bitcoin’s 4-hour chart, suggesting potential short-term correction ahead.
- Despite the recent price uptrend, Bitcoin’s market depth has improved, but not significantly, indicating cautious optimism.
- Despite overbought RSI levels, bullish momentum persists as KST and MACD indicators confirm a strong uptrend in Bitcoin’s price.
The Bitcoin market is buzzing again as traders closely monitor the recent signals flashing on the Technical Analysis charts. As highlighted by Ali Martinez, an analyst, the TD Sequential indicator has just revealed a sell signal on the 4-hour chart, prompting keen observation from investors.
This indicator has demonstrated remarkable accuracy over the past couple of weeks, accurately predicting price corrections ranging between 1.50% and 4.20% since February 15. Such consistent patterns serve as valuable insights for traders navigating short-term movements in the cryptocurrency market.
The TD Sequential flashes a sell signal on the #Bitcoin 4-hour chart!
Since Feb 15, every sell signal from this indicator has been spot-on, leading to $BTC price corrections between 1.50% and 4.20%. This is a pattern worth noting for traders eyeing short-term movements! pic.twitter.com/TQhSG78WF3
— Ali (@ali_charts) February 29, 2024
As per KaikoData, an analytics platform, Bitcoin’s market depth has shown some improvement in the past month. However, given the recent price uptrend, it has yet to surge to the extent one might anticipate.
#Bitcoin market depth has increased over the past month, but not as much as one would expect given the recent price gains 🧐 pic.twitter.com/QSVziKhW2D
— Kaiko (@KaikoData) February 29, 2024
Despite this, optimism remains high among enthusiasts, with some speculating that a new all-time high (ATH) for Bitcoin could be on the horizon, potentially soaring to $74,000 in the near term. The breakout from the green ascending channel on the 3-day chart further fuels this sentiment, propelling Bitcoin swiftly toward the envisioned target.
As of press time, the live Bitcoin price is $63,112.87, showcasing a notable 24-hour trading volume of $87 billion. Over this period, Bitcoin has experienced a commendable uptick of 4.06%, adding to the excitement surrounding its potential trajectory.
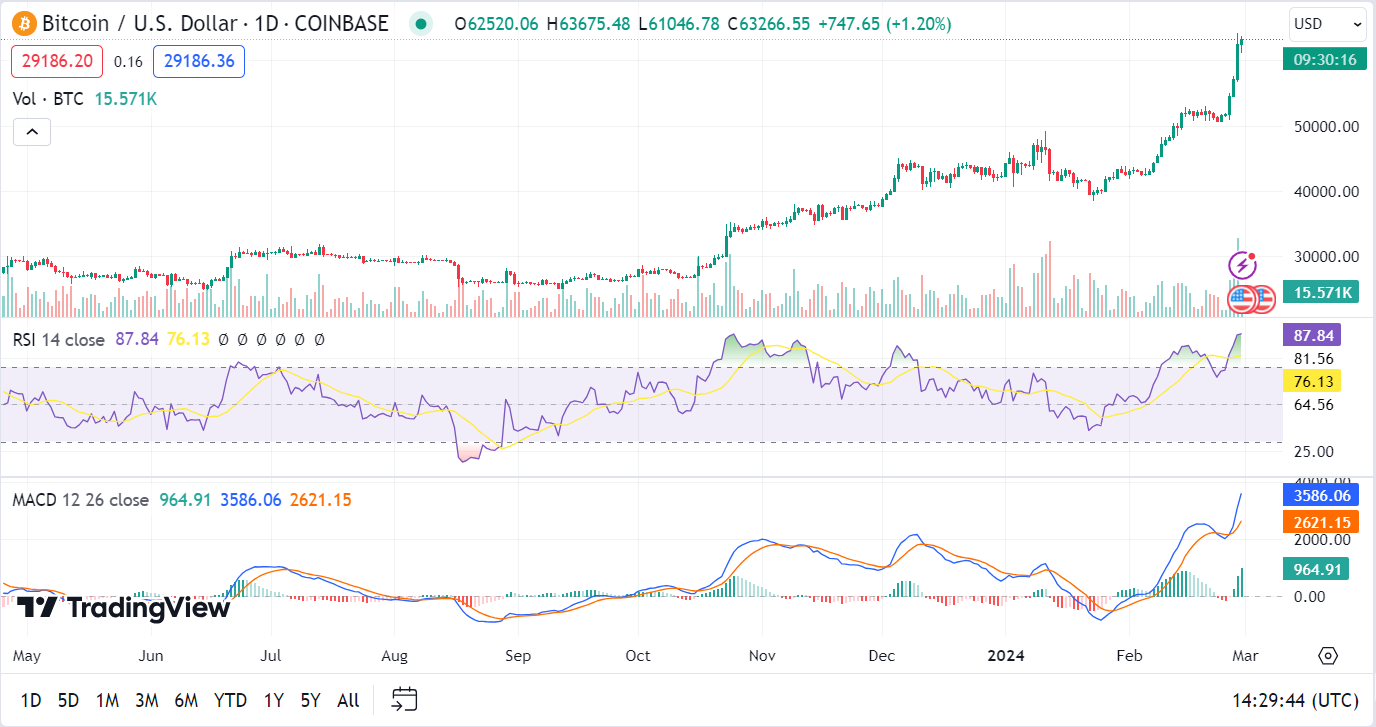
However, caution is advised as the 1-day Relative Strength Index (RSI) currently sits at 87.74, signaling an overbought market in the short term. Despite this, the 1-day Know Sure Thing (KST) indicator indicates robust bullish momentum, instilling confidence in the prevailing uptrend.
Moreover, the 1-Day Moving Average Convergence Divergence (MACD) further validates the bullish sentiment, with its position above both the signal and zero lines. Such alignment typically signifies a solid bullish trend. Nevertheless, traders are urged to exercise prudence amidst the overbought RSI levels, as potential pullbacks or corrections could materialize soon.


