
Bitcoin is showing signs of a potential bullish reversal against USDC in the 30-minute time frame, according to a recent analysis. As highlighted by Ali Martinez, a top analyst, the Relative Strength Index (RSI) is indicating a bullish divergence, while the TD Sequential presents a buy signal. These signals suggest that Bitcoin’s recent downward trend might be losing momentum. If the support level at $65,800 holds, Bitcoin could rebound to the resistance levels of $67,400 or even $68,100.

Currently, Bitcoin’s price has been in a downward trend, marked by a series of lower highs and lower lows on the candlestick chart. This overall downward movement is highlighted by a sloping trend line that connects recent high points. However, key support levels have emerged that could influence a potential reversal. The major support level is around $65,800, where buying interest was previously observed. This level is significant as the price has bounced off it before. Another support level is near $66,000, where the price temporarily halted its decline before attempting to recover.
The immediate resistance is at $66,600, a level where the price has previously struggled to break through and consequently turned back down. Additionally, a higher resistance level is marked at $67,400, a threshold that must be broken for a bullish reversal to be confirmed. The RSI, a key technical indicator, is displaying bullish divergence by forming higher lows while the price forms lower lows. This divergence often signals a potential reversal or, at least, a temporary bounce in the price.
Hong Kong Lawmaker Advocates Bitcoin for Financial Reserves: ReportThe current RSI level is below 30, suggesting oversold conditions, which could lead to an upward correction if the RSI begins to rise. Besides the RSI, the 1-day MACD is trading above the signal line, indicating bullish momentum in the short term. Two possible scenarios could unfold based on the current market conditions. A bullish reversal could occur if the price breaks above the immediate resistance of $66,600 with strong trading volume.
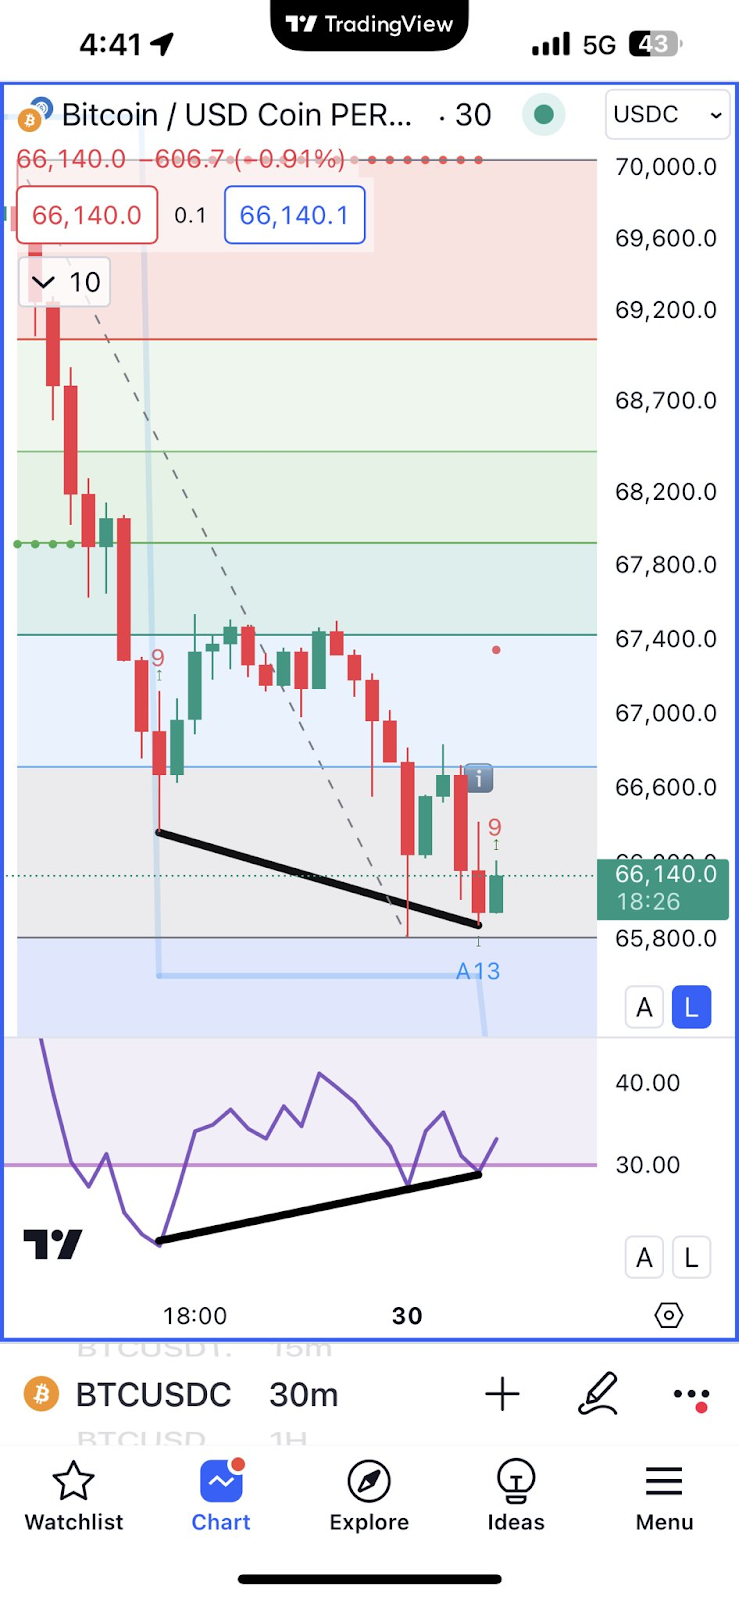
If this happens, the next target would be the resistance level at $67,400. This move would gain further confirmation if the RSI continues to rise, indicating growing buying momentum. On the other hand, a continued bearish trend could emerge if the price fails to break above $66,600 and drops below the major support at $65,800, potentially leading to further declines.
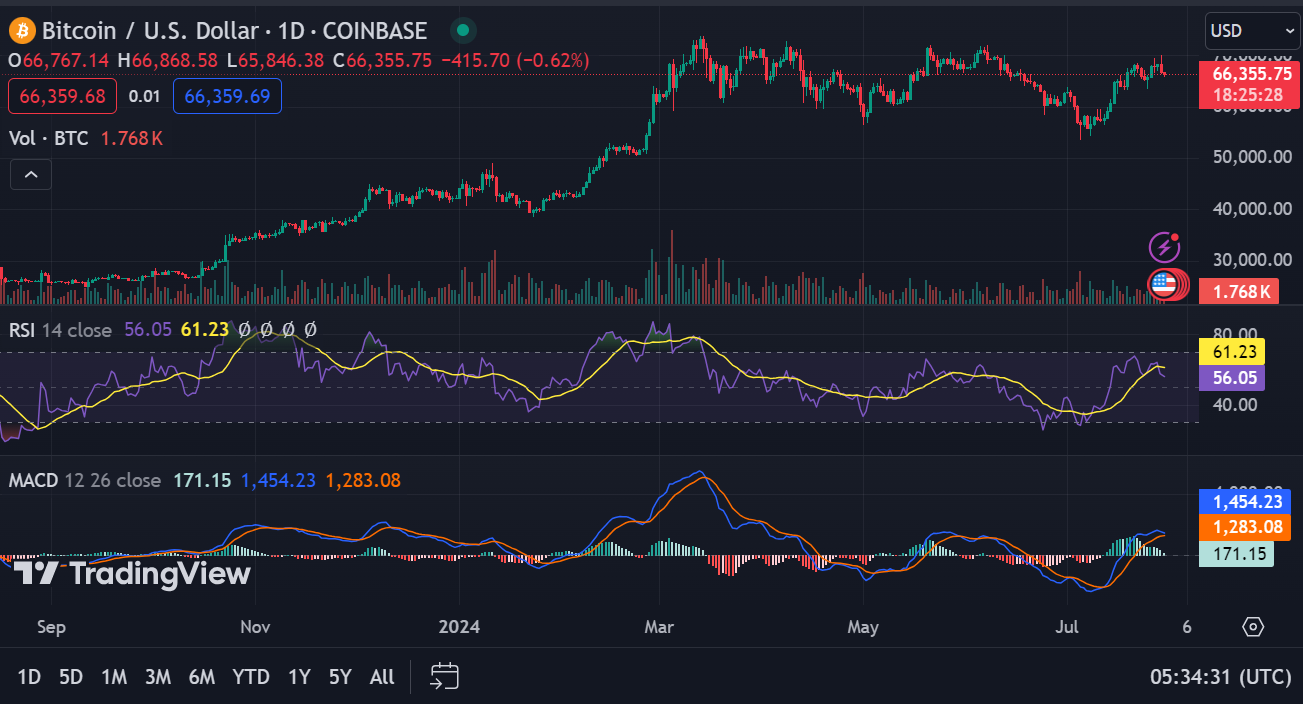
At press time, Bitcoin’s price is $66,669.24, with a 24-hour trading volume of $40,369,328,820. Bitcoin has decreased by 4.00% in the last 24 hours. The 1-day RSI reads 56.05, indicating a neutral market state. However, the MACD’s position above the signal line suggests bullish momentum might continue in the short term.