
The cryptocurrency market is buzzing with excitement as Injective (INJ) and Celestia (TIA) exhibit notable chart patterns that suggest significant price movements could be on the horizon. Captain Faibik’s analysis suggests that the INJ/USDT trading pair is forming a falling wedge pattern in the three-day timeframe, which typically signals a potential bullish reversal. This pattern is still in play, with bullish investors anticipating a breakout that could lead to a new all-time high in late September or early October.
The price trend of INJ/USDT is moving within a descending channel characterized by lower highs and lower lows. However, the channel’s lower boundary, around $15-$16, has repeatedly acted as a strong support level.
Historical data suggests buyers consistently step in at this level, reflecting strong buying interest. Conversely, the upper boundary of the channel, around $20-$22, has been a key resistance level. The price has faced selling pressure, leading to multiple rejections.
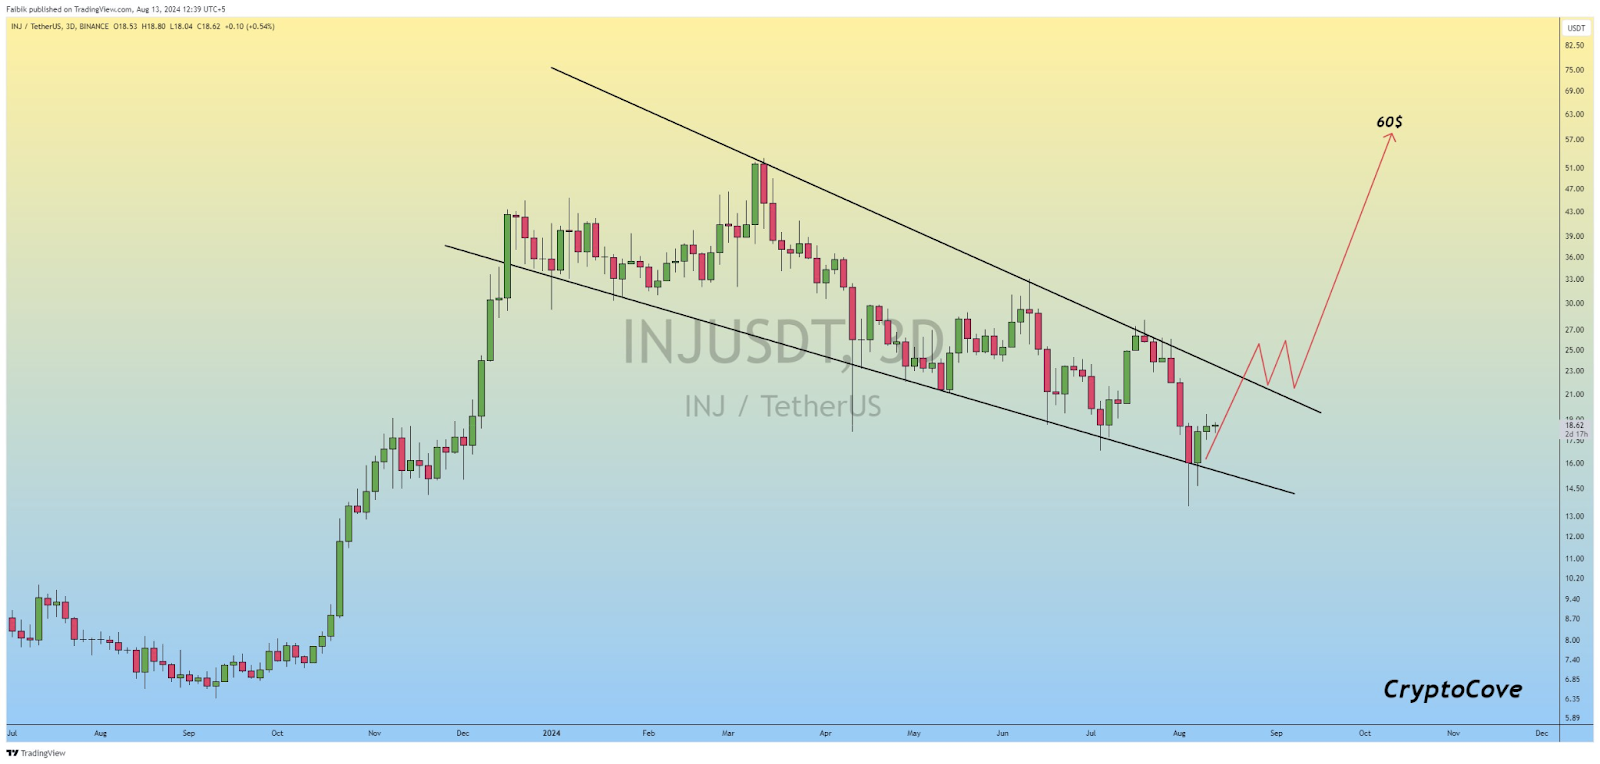
Despite these rejections, there is a growing expectation of a potential breakout above the descending channel. A breakout above the $22-$23 level would likely signal a trend reversal, driving the price toward the $60 target. This projection aligns with historical price levels, and if realized, it could represent a significant bullish move for INJ. As of press time, the price of Injective is $18.37, down 1.66% in the last 24 hours. Its 24-hour trading volume is $93,026,453.
In an analysis by World Of Charts, the TIA/USDT trading pair also shows price movement within a descending channel, indicative of a bearish trend. The price trend is marked by lower highs and lower lows, with the lower boundary of the channel, around $4.30-$4.50, acting as a primary support level.
Buyers have repeatedly stepped in at this level, suggesting strong support. However, the upper boundary of the descending channel, around $6.00-$6.20, remains a key resistance level. The price has struggled to break above this level, indicating strong selling pressure.
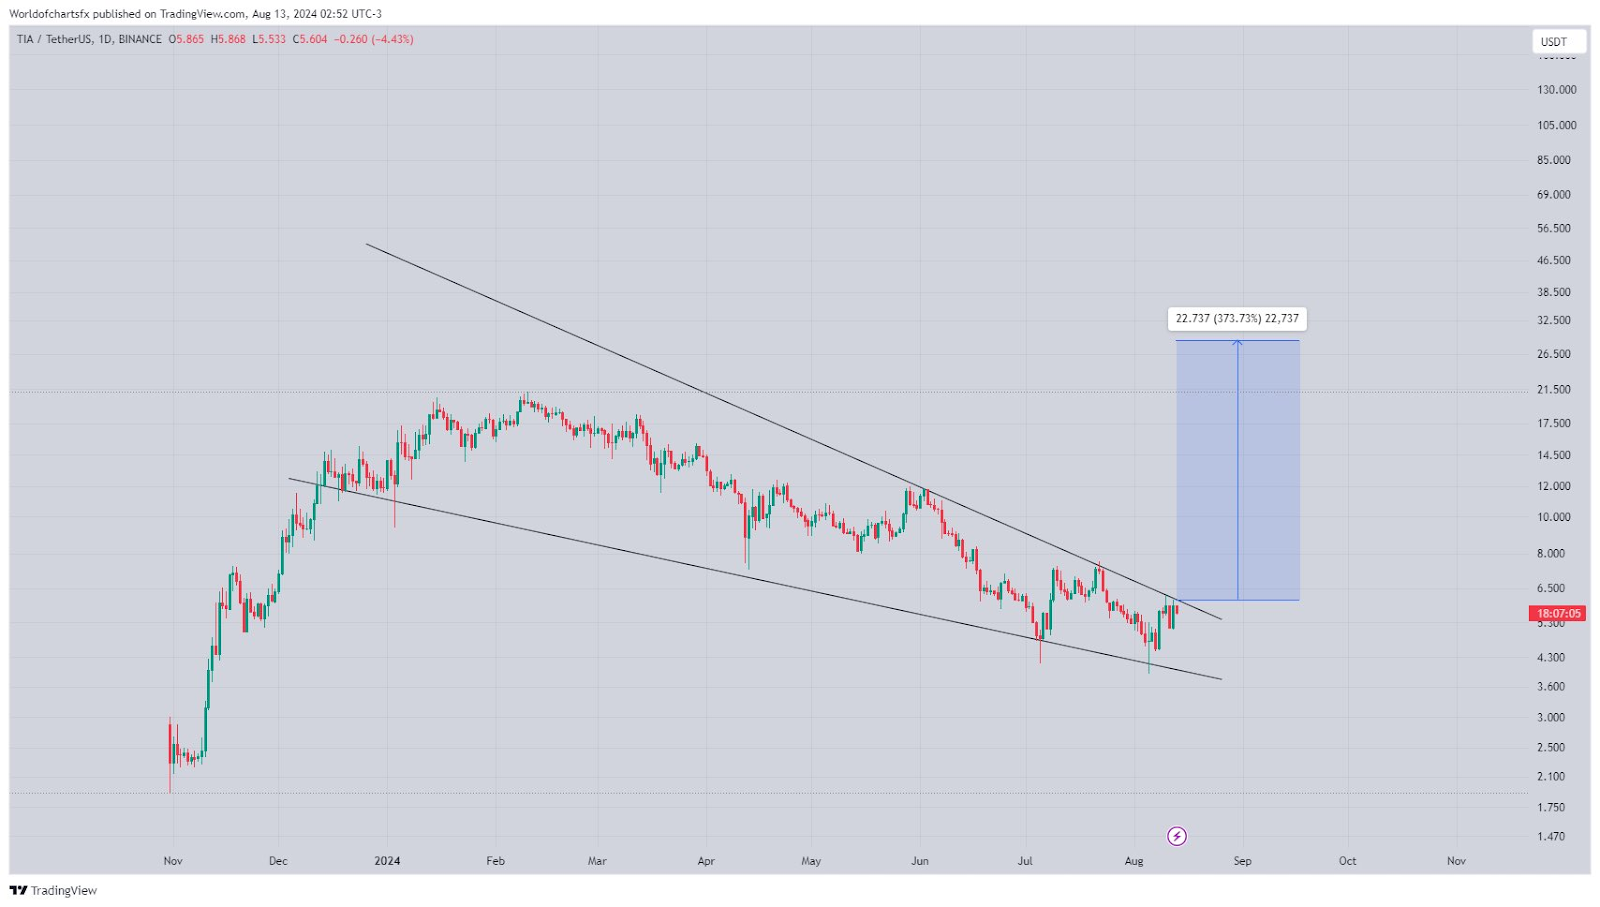
Nevertheless, a potential breakout scenario is on the horizon. A successful breakout above the channel’s upper boundary could signal a trend reversal, with a projected target of nearly $30. This target represents a potential upside of around 373.73%, aligning with historical resistance levels and previous highs. At the time of writing, the price of Celestia is $5.58, down 3.52% in the last 24 hours, with a trading volume of $98,879,841.