
- Toncoin tests the $7.60 resistance level, crucial for a safer market entry amid fluctuating prices.
- Recent trends show Toncoin’s higher lows, indicating bullish pressure as it nears resistance.
- Toncoin’s price decline of 7.70% in the last week highlights market volatility near the $7.60 level.
According to Crypto Tony, an analytic account on X, Toncoin (TON) has been drawing attention as it nears a crucial resistance level of $7.60. This level is considered pivotal for traders seeking a safer entry point into the market. The price has been fluctuating, indicating a potential breakout or a possible pullback.
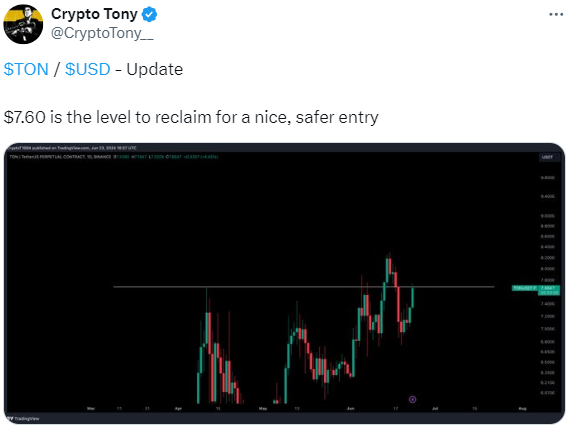
The Toncoin price chart shows a persistent horizontal resistance line at $7.60. Currently, the price is inching closer to this resistance level, marking a critical juncture for potential market movements. Recent price action reveals an upward trend towards the $7.60 resistance, despite several failed attempts to break this level in the past.
Toncoin’s recent price action indicates a bullish trend with higher lows, suggesting accumulating buying pressure. Per the analyst, a sustained break above this level, accompanied by strong trading volume, could signal a bullish breakout. For traders, a daily close above $7.60 is recommended to mitigate the risk of a false breakout.
Binance Boosts Crypto Capabilities with USDT Integration on Toncoin NetworkOver the past seven days, Toncoin has seen a price decline of 7.70%, underperforming the global cryptocurrency market, which is down 5.70%. In comparison, similar GMCI 30 Index cryptocurrencies have remained stable with no significant price movement.
Toncoin’s price stands at $7.30, with a 24-hour trading volume of $377,151,456.49, reflecting a 3.98% decline in the last 24 hours and a 7.69% decline over the past week. With a circulating supply of 2.5 billion TON, the market cap of Toncoin is valued at $17,982,187,580.
This is only days after Toncoin exhibited intriguing market behavior. On June 20, key indicators suggest potential distribution activity. The Coin Days Destroyed (CDD) indicator has shown significant movements by long-term holders, suggesting a potential price peak around $8. The CDD indicator multiplies the number of coins moved on-chain by the number of days since those coins were last moved. This activity signals that long-term holders might be taking profits, preparing the market for a possible price correction.