
- Bitcoin RSI dip below 30 signals potential buy opportunities with significant price increases.
- Strong Buy TWAP on Coinbase shows sustained institutional buying pressure in Bitcoin.
- Bitcoin has experienced a -5.66% decline over the past seven days.
Bitcoin’s market analysis has seen significant interest from cryptocurrency analysts on X. Recently, Ali Martinez and Daan Crypto Trades provided insights that could guide traders in understanding Bitcoin’s price movements. Both analysts emphasized specific indicators that suggest potential buying opportunities and ongoing market dynamics.
Ali Martinez highlighted the effectiveness of the RSI as a tool for timing Bitcoin dips. Traditional interpretations suggest that an RSI above 70 indicates an overbought condition, while values below 30 suggest an oversold condition. Martinez’s analysis revealed that significant price increases usually followed after a dip in the RSI level.
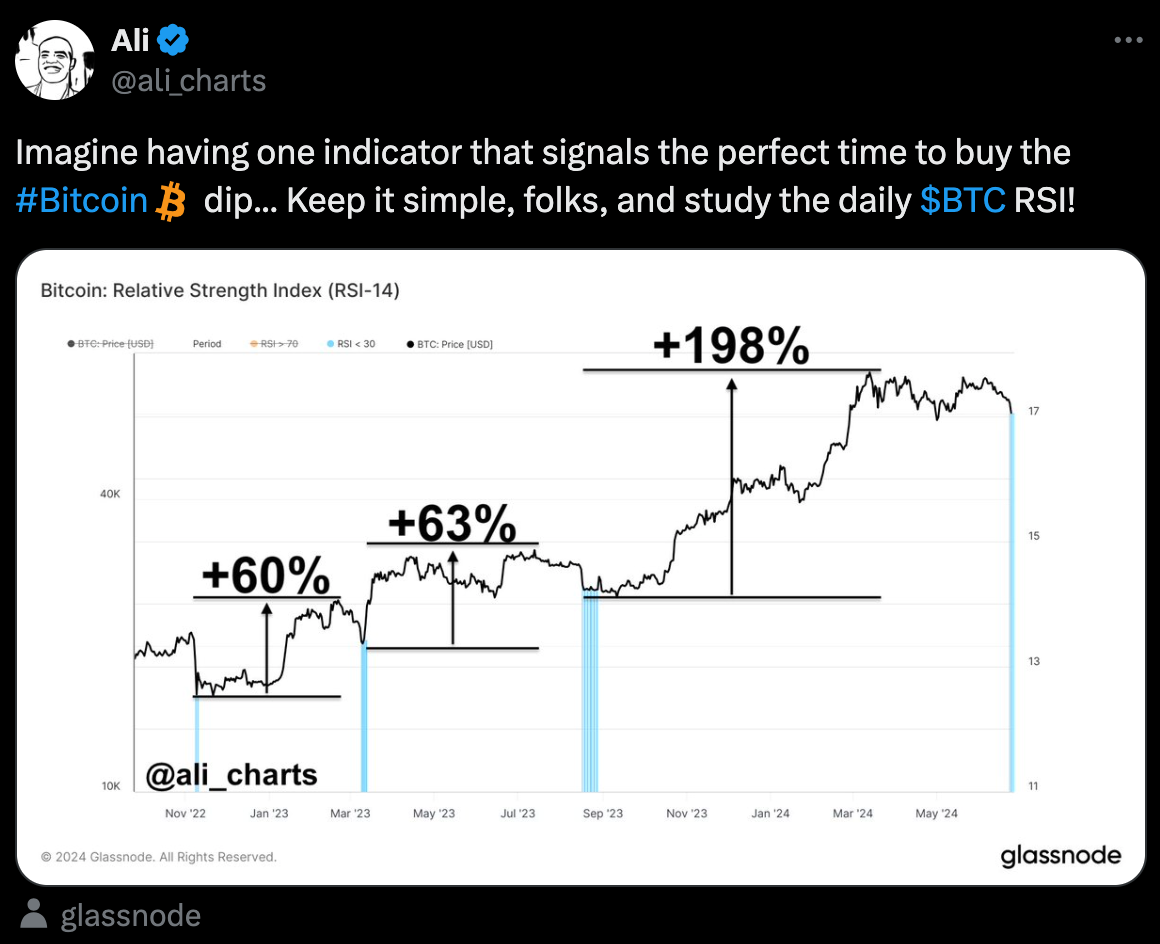
In November 2022, Bitcoin’s price surged by 60% following an RSI dip to an oversold level. Similarly, in March 2023, another RSI dip led to a 63% price rise. The most significant increase occurred in September 2023, where an RSI dip resulted in a 198% price surge. These patterns indicate that RSI dips can serve as reliable indicators for identifying potential buy opportunities during market downturns.
Bitcoin Slips Below $62,000 as Market Cap Declines: What’s Next for Investors?Daan Crypto Trades pointed to the Buy TWAP on Coinbase as another critical indicator. The TWAP, a trading algorithm, executes large orders over a specific period to minimize market impact. A strong Buy TWAP suggests sustained buying pressure, indicating significant interest from institutional or large-scale investors.

The chart shared by Daan Crypto Trades included several elements: a heatmap showing high trading activity levels, green volume bars indicating strong buying interest, and the CVD+ indicator, which measures the difference between buying and selling pressure. Positive CVD suggests more buying than selling pressure, reinforcing the bullish sentiment.
At press time, Bitcoin’s price stood at $61,747.41, with a 24-hour trading volume of $28,590,083,133.41. Despite a 0.65% increase in the last 24 hours, Bitcoin has experienced a -5.66% decline over the past seven days. Analysts’ insights into RSI and TWAP offer valuable tools for traders navigating these market fluctuations. By observing these indicators, traders can potentially make more informed decisions about their Bitcoin investments.