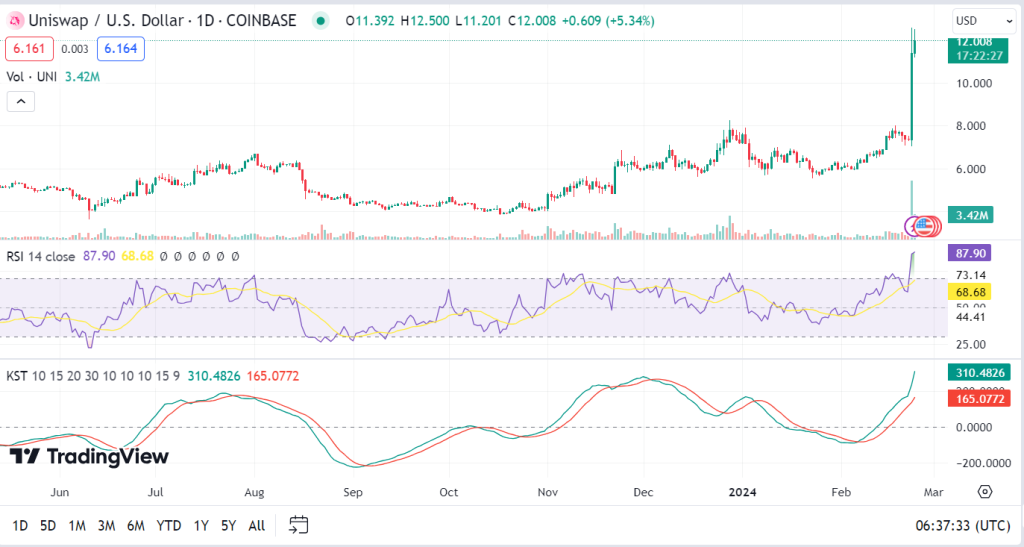
- Uniswap’s 71.21% surge signals strong market interest, but RSI at 87.95 hints at potential overbought conditions and upcoming correction.
- Despite bullish MACD and KST momentum, Uniswap faces crucial resistance, suggesting careful market watch for signs of price rejection.
- The anticipated “accumulation” zone could present a strategic entry point for investors, amidst warnings of a possible sharp price drop.
Uniswap has recently emerged as a notable player, experiencing a significant surge in its price. The digital currency saw an impressive 71.21% increase in value over the last 24 hours, pushing its price to $12.91. This remarkable upswing has drawn the attention of traders and investors alike, sparking discussions about the asset’s future trajectory.
Prominently, the recent price movement of Uniswap has resulted in some critical technical indicators hitting remarkable levels. Relative Strength Index (RSI), a major indicator which is used to measure the level whether the asset is overbought or oversold condition, stands at 87.95 for Uniswap. This indicates that the cryptocurrency might be overbought implying an imminent price correction.
Moreover, the Moving Average Convergence Divergence (MACD), an indicator used to identify bullish or bearish momentum, trades above its signal line. This indicates a continued bullish momentum, potentially driving further price increases if the trend persists.
Additionally, the Know Sure Thing (KST) indicator, another momentum gauge, shows strong positive momentum in the market. This could support the argument for continued growth in Uniswap’s price despite the overbought conditions signaled by the RSI.

However, the analysis of support and resistance levels reveals a nuanced picture, as the price of Uniswap recently tested a significant upper resistance level, indicated by the blue lines on the chart. This is a crucial juncture where the market has historically reacted significantly, often leading to price rejections.
Besides, the pink area and downward arrow on the chart suggest a potential sharp price drop, indicating an expectation of a price fall after hitting resistance or due to a distribution phase. This aligns with the weak market sentiment, suggesting that the asset might face challenges in sustaining its current upward trajectory.
Hence, while Uniswap’s recent performance has been stellar, traders and investors must tread carefully. As highlighted by CryptoCapo, an analyst, the market looks weak with a critical resistance point, and the overbought conditions signal the possibility of a forthcoming correction. Consequently, the yellow highlighted area represents a potential “accumulation” zone, where buying interest could re-enter the market, offering a strategic point for those looking to capitalize on the asset’s volatility.


