
- Uniswap’s daily chart hints at a bullish breakout towards a $6 target, supported by a four-hour bull flag pattern.
- Despite a 5.35% surge in the last 24 hours, the RSI at 63.81 suggests a relatively stable market for UNI.
- Long-term EMA indicators indicate a bearish trend, urging caution among traders and investors.
Uniswap’s recent performance has been catching the attention of cryptocurrency enthusiasts and investors alike. With a live price of $5.025033 per UNI token and a market cap of $2.96 billion , the digital asset is currently making strides in the market, showing signs of potential bullish momentum.
On the technical side, the charts are painting an interesting picture. As pointed out by Ali, a prominent blockchain figure, the daily chart indicates that UNI is approaching the hypotenuse of a descending triangle, with a target price of around $6. This suggests that there might be an upward breakout on the horizon. Moreover, the four-hour chart reveals a breakout from a bull flag pattern, aligning with the $6 price target.
#Uniswap's bullish momentum is heating up! 📈
— Ali (@ali_charts) November 7, 2023
On the daily chart, $UNI is eyeing the hypotenuse of a descending triangle, targeting around $6. Plus, the four-hour chart reveals #UNI breaking out of a bull flag, aligning with the $6 target.
Ready to trade #Uniswap? Join us at… pic.twitter.com/93HWJ9ivlg
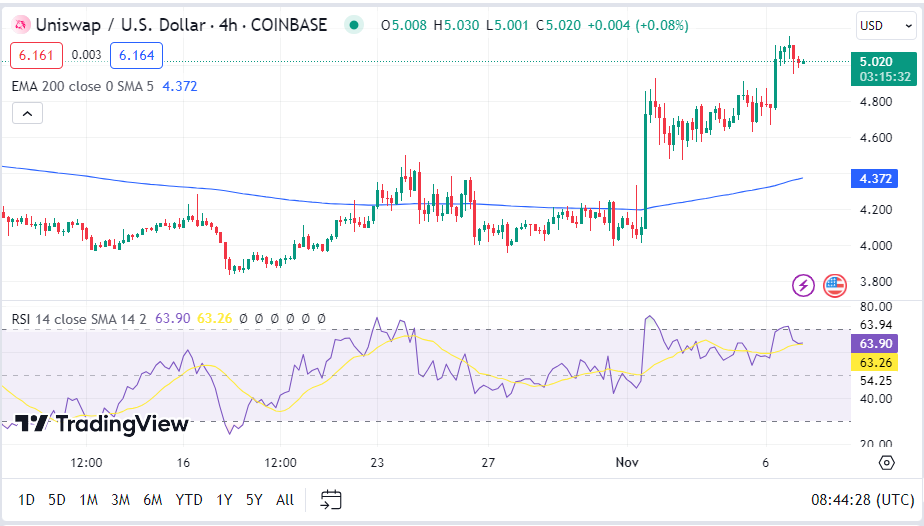
In the last 24 hours, Uniswap has surged by 5.35%, which is a notable increase. The Relative Strength Index (RSI) is currently at 63.81, suggesting that UNI’s price is in a relatively stable state, neither overbought nor oversold. This indicates a moderate level of buying and selling pressure in the market.
Looking at the Bollinger Bands, the upper band is reading 5.161, indicating a potential resistance level in the near future. Traders should closely monitor price movements and other indicators that could signal a change in market sentiment. On the flip side, the lower Bollinger Band reads 4.552, suggesting that UNI’s price is near its support level, which may limit downside potential in the short term.
Adding to the support levels, the 50-period Exponential Moving Average (EMA) is at 4.659, reinforcing the idea that UNI’s price is currently near a stable level. This moving average can act as dynamic support or resistance.
However, it’s important to note that the 100-period EMA is reading 4.475, indicating a longer-term downward trend. This raises caution and suggests the potential for continued price decline. Moreover, the 200-period EMA is even lower at 4.372, confirming the bearish sentiment and the possibility of an intensified downward trend.
Uniswap’s recent price movements and technical indicators present a mixed picture. While there are signs of potential bullish momentum, the longer-term trends suggest caution. Traders and investors should carefully analyze these factors and stay vigilant for any changes in market dynamics that could impact UNI’s price in the coming days. The crypto market is known for its volatility, so staying informed and adapting strategies accordingly is crucial for success.