


- Bitcoin shows potential for a bullish breakout, supported by MACD and RSI indicators.
- Critical support at $57,000 suggests strong buying interest, influencing short-term price movements.
- Resistance levels near $58,500 and $62,000 could determine Bitcoin’s next major price direction.
The Bitcoin market is poised for a potentially massive rally as several technical indicators align favorably. The MACD bullish cross and RSI bullish divergence appear similar to the patterns in Q3 2023, according to MikybullCrypto. It could be a signal for significant price movement.
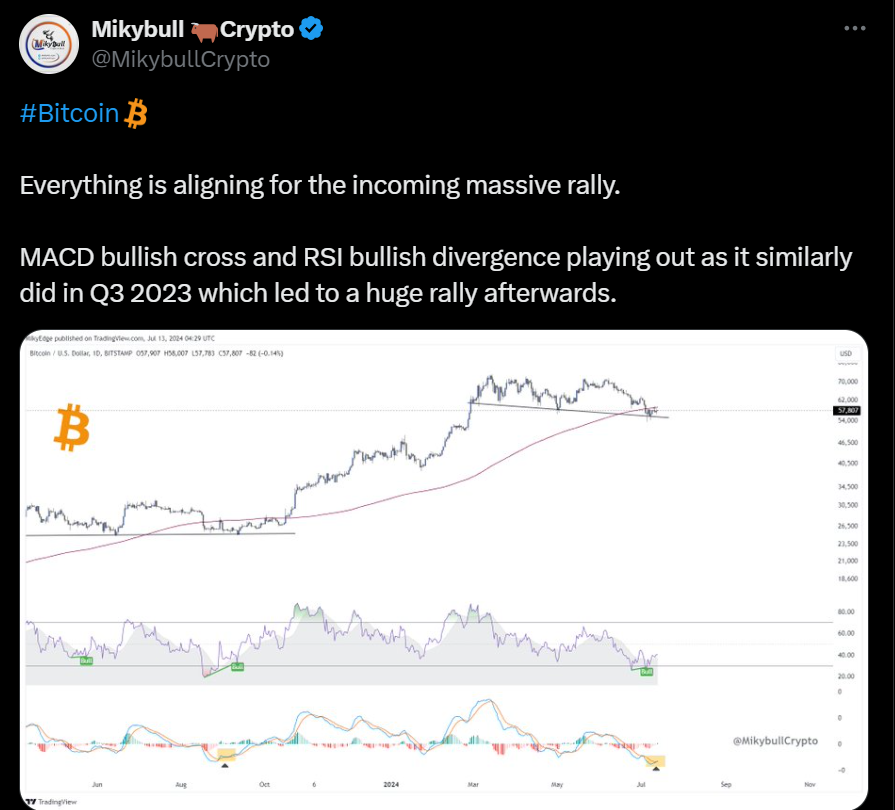
Bitcoin’s price currently tests a support level around $57,000, slightly above the critical 200-day moving average. This red line serves as a vital support, and a breakdown below it could signal further downside risks. Conversely, a robust hold at this level might pave the way for substantial gains.
Bitcoin’s Fear and Greed Index Plummets to Historic Low, Shows Extreme GreedThe RSI, presently below 50, indicates bearish sentiment. However, it has bounced from the oversold territory, hinting at a potential price reversal. Historical data shows that previous RSI levels marked as “Bull” were points of bullish divergence. The MACD remains below the signal line, signaling bearish momentum. But, the histogram’s decreasing bearish momentum suggests a possible bullish crossover soon.
Bitcoin faces immediate resistance around $58,500. This level is significant as it aligns with the upper boundary of a recent horizontal consolidation. Breaking above this could confirm a bullish breakout. The key resistance level stands at $62,000, which, if surpassed, might lead to new all-time highs.
As further noted by World Of Charts, an analyst, Bitcoin also approaches the crucial resistance area of $59,200. A successful breakout here could see the price move towards previous all-time highs.
The price has been moving within a descending channel since late May, with the upper boundary acting as resistance and the lower boundary as support. Immediate support is around $57,000, a level that has provided support multiple times recently. A lower support level is approximately $53,800 near the lower boundary of the descending channel.
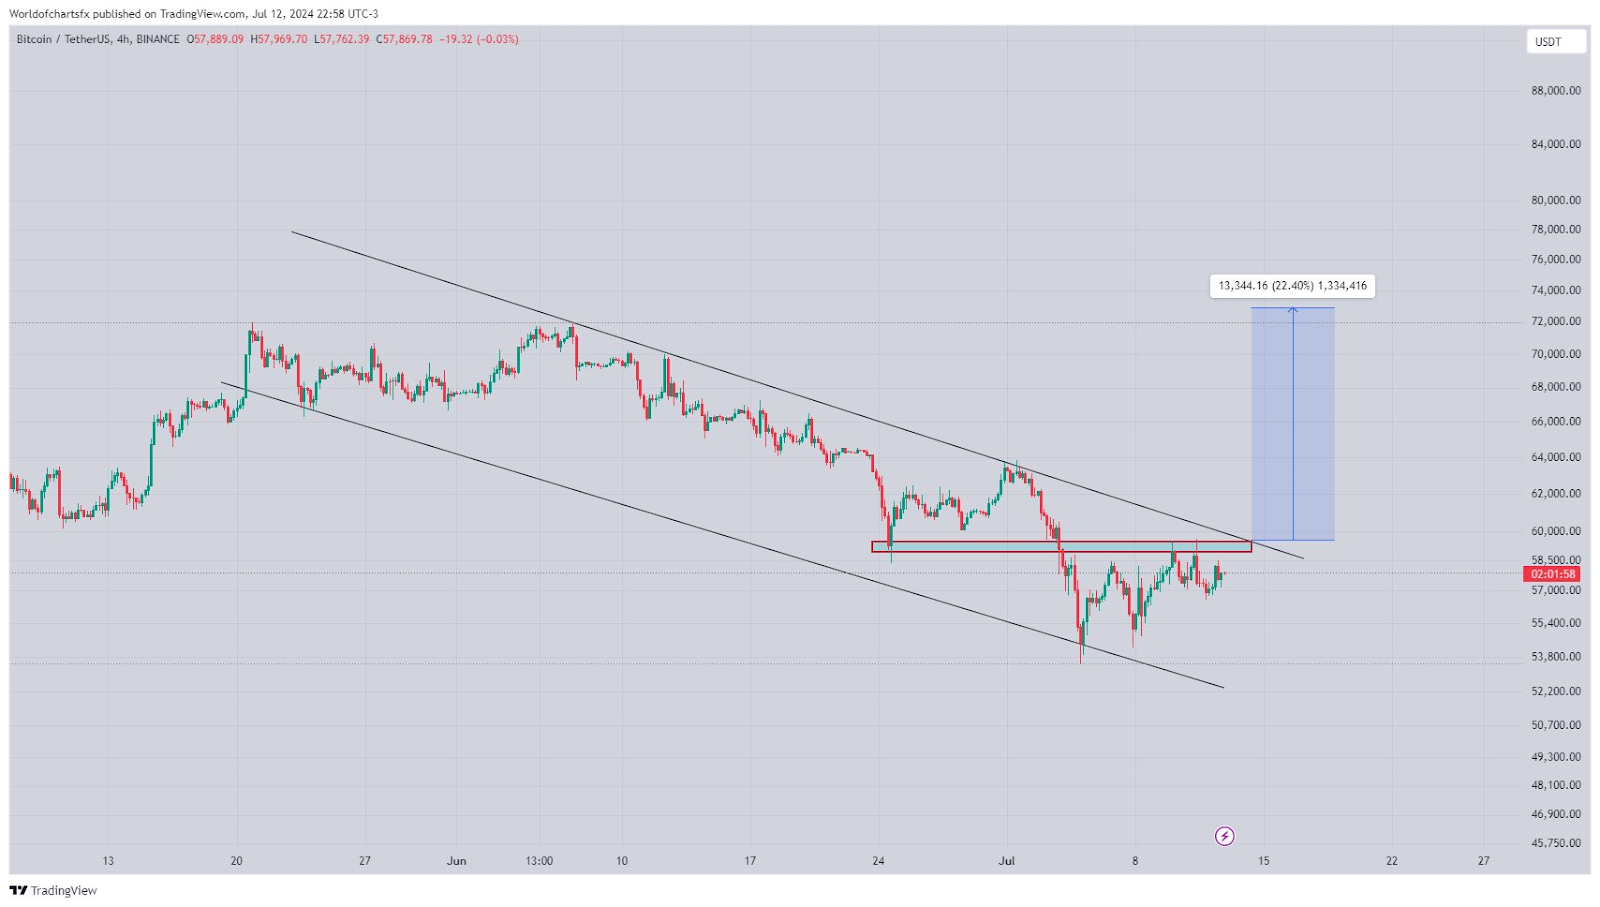
If Bitcoin breaks above the immediate resistance at $58,500 and sustains above the descending channel’s upper boundary, it could indicate a bullish breakout. The projected target for this breakout is around $71,000, representing a 22.4% increase from the current price.
As of press time, Bitcoin’s price stood at $57,802.80, with a 24-hour trading volume of $22,917,947,009. It is up 1.57% in the last 24 hours. This weekend would be a crucial day for traders to watch the movements of BTC. As a breakthrough beyond the $59,200 resistance could lead upto a surge of 22%.


