


- Bitcoin’s $60,000 level may flip from resistance to support, influencing potential bullish trends.
- Bitcoin could dip to $40,000 before reaching $100,000, based on historical patterns and current indicators.
- Current indicators show a neutral RSI and bullish MACD, suggesting Bitcoin’s future could lean positive.
Bitcoin’s price trajectory has long been a focal point of market speculation and analysis. As of press time, Bitcoin (BTC) is trading around $60,836.76, showing a 2.81% increase over the past 24 hours. This recent rise comes as Bitcoin tests a critical resistance level. Analyst Cryptoknight’s recent study of Bitcoin’s technical indicators shed light on whether Bitcoin might experience a “max pain” scenario, potentially dipping to $40,000 before reaching the $100,000 mark.
Cryptoknight’s weekly price chart suggests that between 2020 and 2023, Bitcoin demonstrated significant price patterns. The $30,000 to $40,000 range emerged as a crucial support zone. This level repeatedly served as a safety net during market pullbacks, with Bitcoin bouncing back whenever it approached this range. Conversely, the $60,000 level posed a strong resistance. Bitcoin tested this level multiple times, forming a double top pattern in 2021, which led to a notable market correction.
Bitcoin Repeats Halving History: Will 30% Dip Lead to a Massive Breakout?Throughout these years, Bitcoin also went through consolidation phases, particularly within the $30,000 to $40,000 range. These periods were characterized by price movements that either broke out of or fell below this range. This historical context is important for understanding Bitcoin’s current behavior.
Bitcoin trading near $60,956, reflects a breakout from the $40,000-$60,000 consolidation range. This breakout suggests a shift in market sentiment towards a more bullish outlook. Nevertheless, Bitcoin is approaching the $60,000 level, which has historically been a significant resistance point. If the price continues to rise, this resistance could potentially turn into support, marking a critical shift in market dynamics.
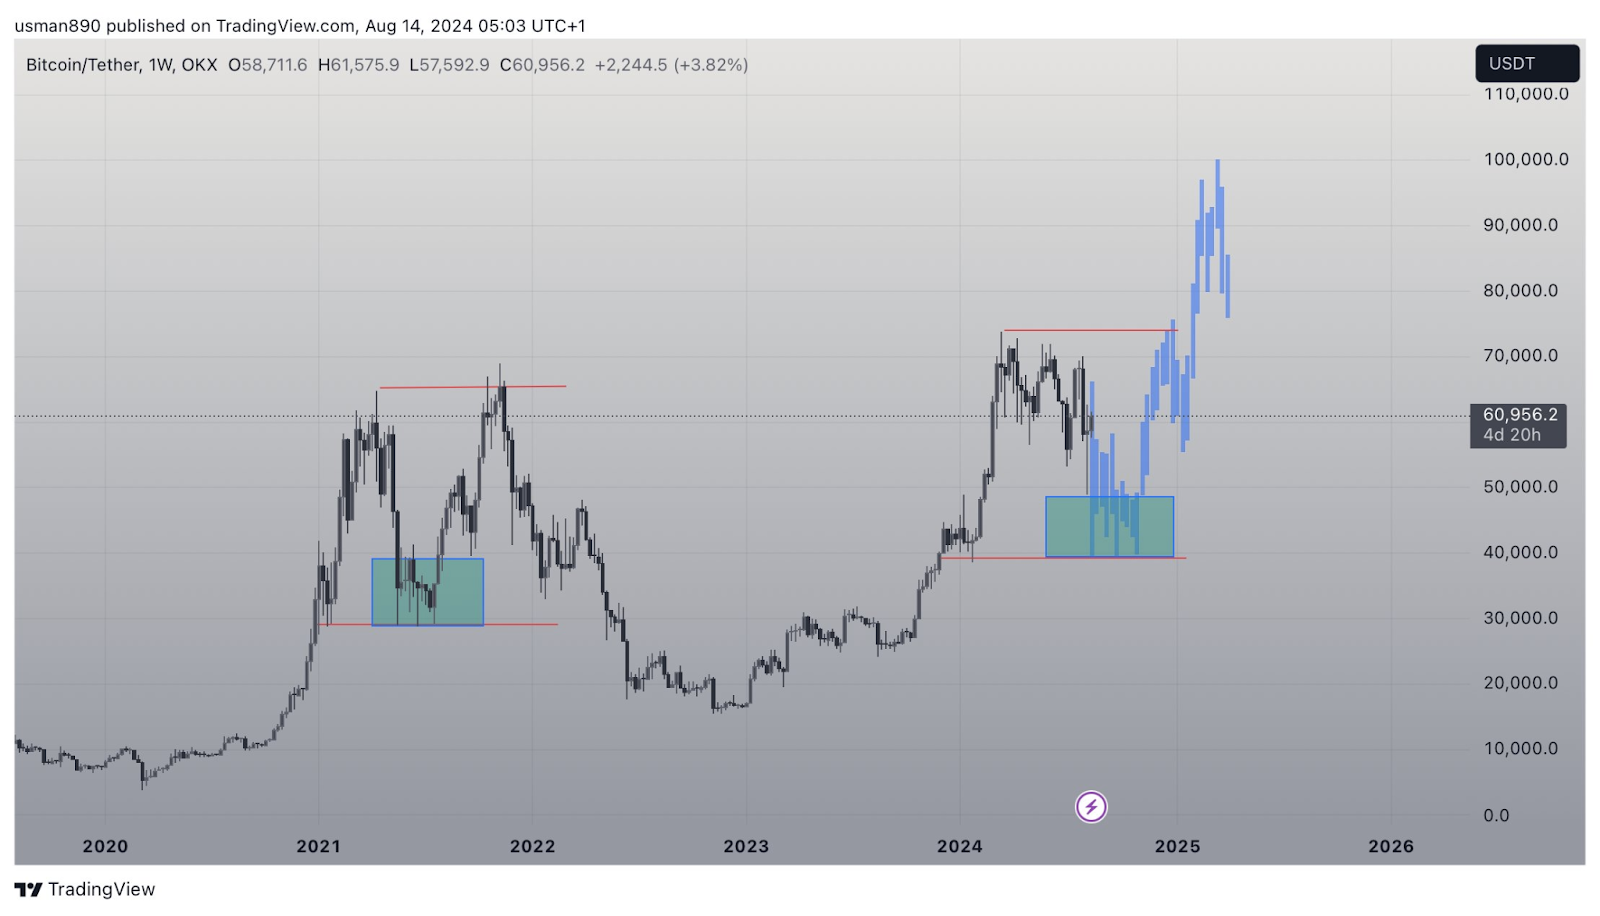
Estimates suggest that Bitcoin could reach between $80,000 and $100,000, provided the breakout holds and the upward momentum continues. However, before making substantial gains, Bitcoin might retest the $60,000 level. Such retracements are typical in market behavior, where resistance levels often become support levels after a breakout.
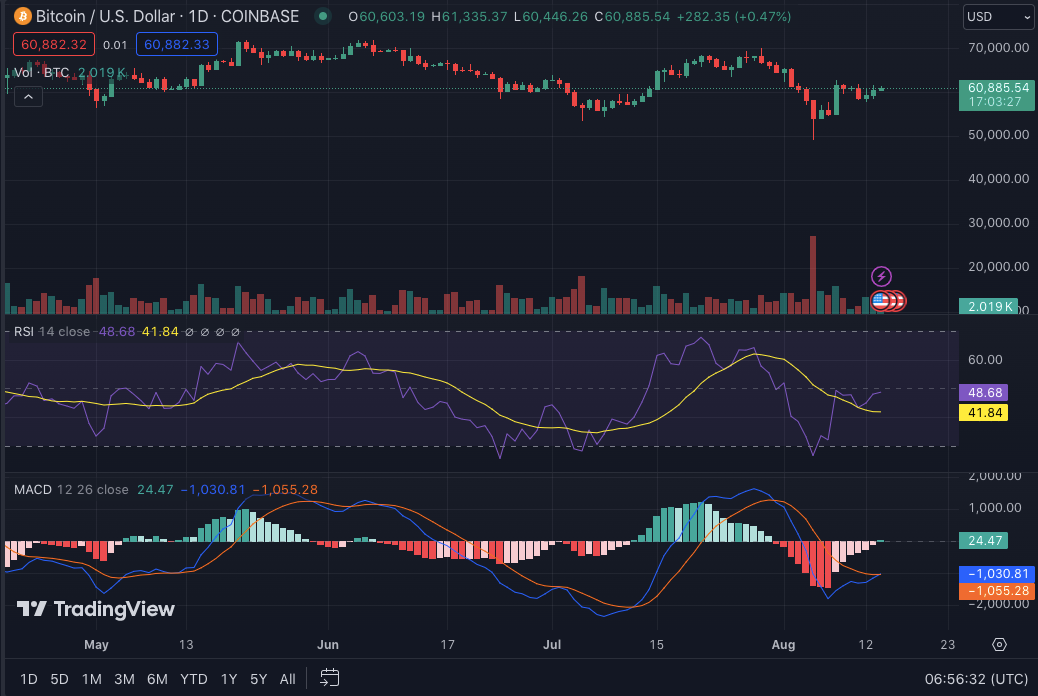
Current technical indicators offer additional insights. The 1-day Relative Strength Index (RSI) stands at 48.68, indicating a neutral market state. The 1-day MACD is trading above the signal line, suggesting potential bullish momentum.


