
- Bitcoin’s triangular pattern suggests imminent price movement; breakout or breakdown is likely.
- Bearish RSI divergence indicates a potential decrease in Bitcoin’s market momentum.
- The surge in trading volume highlights increased market interest and activity levels.
Bitcoin, a leading cryptocurrency, is currently experiencing pivotal price movements, as outlined by crypto analyst Charting Guy. His recent analysis on TradingView highlights a notable triangular pattern that may signal a breakout.
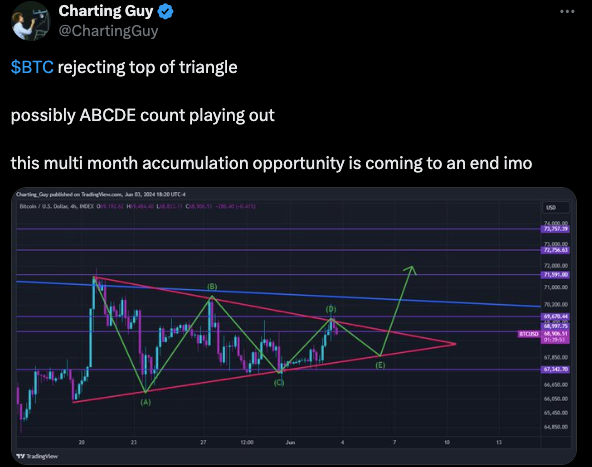
The latest insights from Charting Guy suggest that Bitcoin is on the cusp of a significant market shift. The cryptocurrency has traced a complex sequence of triangular patterns.
At the time of writing, Bitcoin’s value has seen a decline of 0.11% over 24 hours to settle at $68,917. Despite the modest slide, the cryptocurrency experienced notable daily volatility, with prices peaking sharply before tapering off again.
The digital currency’s market capitalization remains strong at $1.36 trillion, positioning Bitcoin at the forefront of the crypto market. Trading volumes surged by 46.05%, indicating heightened trader activity, totaling $30.73 billion.
This ongoing pattern, marked from points (A) to (E), suggests a broadening formation, hinting at upcoming volatility. Crypto enthusiasts and traders are mainly focused on point (E). This crucial juncture could either catapult Bitcoin towards a new all-time high, surpassing $74,000, or tumbling to support levels near $67,342.
Charting Guy’s analysis proposes that a decisive break above the triangle could ignite a bullish trend for Bitcoin, setting the stage for altcoins to surge. In a related development concerning Bitcoin’s market dominance, the analysis points to a rejection at critical resistance levels akin to past patterns.
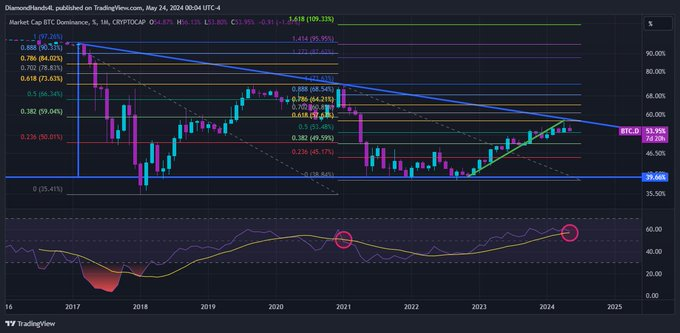
The chart reveals a bearish divergence in the weekly Relative Strength Index (RSI), suggesting that the momentum has waned since its peak in October. The wave trend indicators also appear to top out, signaling potential downturns.
Currently, Bitcoin’s dominance stands at 54.59%, with its monthly RSI nearing a bearish crossover for the first time since January 2021. This analysis paints a picture of a market at a crossroads, with the next movements likely to define the trend for the coming months.
Bitcoin’s current triangle pattern may indicate an imminent breakout or breakdown. Resistance levels around $72,500 to $73,200 are pivotal for upcoming price trends. Bearish divergence in Bitcoin’s RSI suggests a potential decline in market momentum.
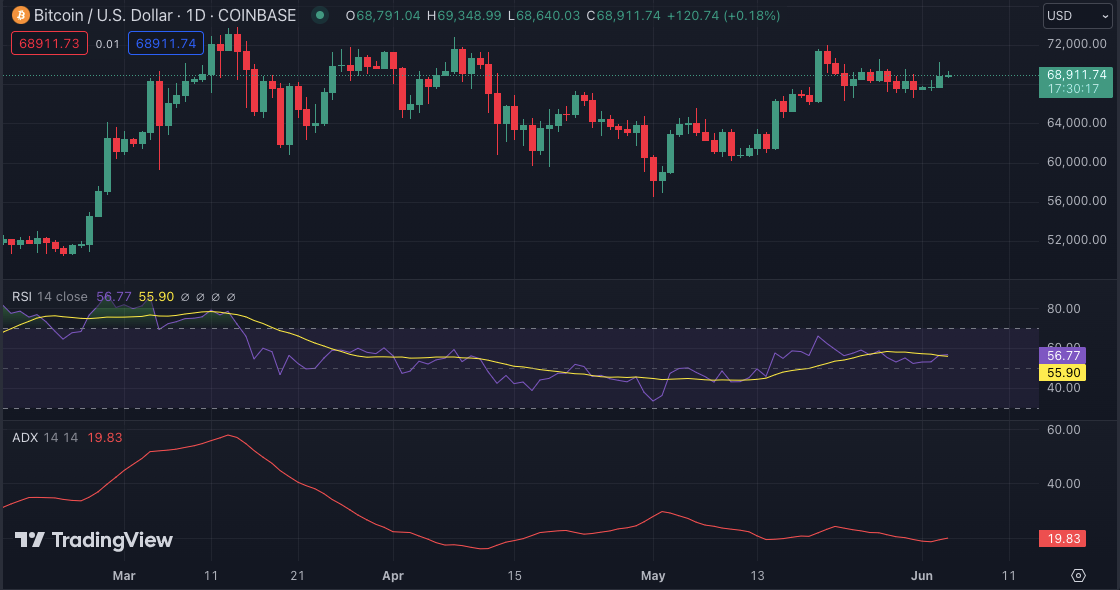
The 24-hour technical indicator shows Bitcoin’s price resilience amid market fluctuations.The Relative Strength Index (RSI) stands at 58, nestled comfortably above the midpoint of 50. This suggests a neutral market momentum, with neither overtly bullish nor bearish trends dominating. In contrast, the Average Directional Index (ADI), at 19.83, paints a different picture, signaling a weaker trend strength.