


- Solana’s TD Sequential indicates reversal on daily, four-hour, and hourly charts.
- Analyst highlights the bullish inverse head and shoulders pattern, which has played a key role in Solana’s recent surge.
- The RSI indicator suggests Solana is nearing overbought territory, signaling the possibility of a price correction.
Solana (SOL) has been on a remarkable upward trajectory, capturing the attention of the crypto community. However, recent analyses suggest that this bullish trend may soon face a reversal. Both Ali and Charting Guy have shared insights on Solana’s current market conditions, highlighting crucial indicators that traders should watch closely.
Ali, a well-known trader, pointed out the emergence of sell signals for Solana across multiple charts. According to him SOL’s trajectory on the daily, four-hour and hourly charts are exhibiting sell signals. This pattern, known for predicting trend reversals, suggests that the current upward momentum may be short-lived. Ali’s observation is crucial for traders who are considering to take profits or re-evaluate their positions.

On the other hand, Charting Guy provided a broader perspective on Solana’s price action. He shared an update on a long-standing thread where he previously called out Solana at $14. His latest chart analysis highlights a well-formed inverse head and shoulders pattern, typically a bearish indicator, that Solana has broken out of. Despite this, the current trend shows a bullish pennant formation, signaling a possibility for continued upward movement. The Relative Strength Index (RSI) and Stochastic Oscillator also indicate that the momentum remains strong.
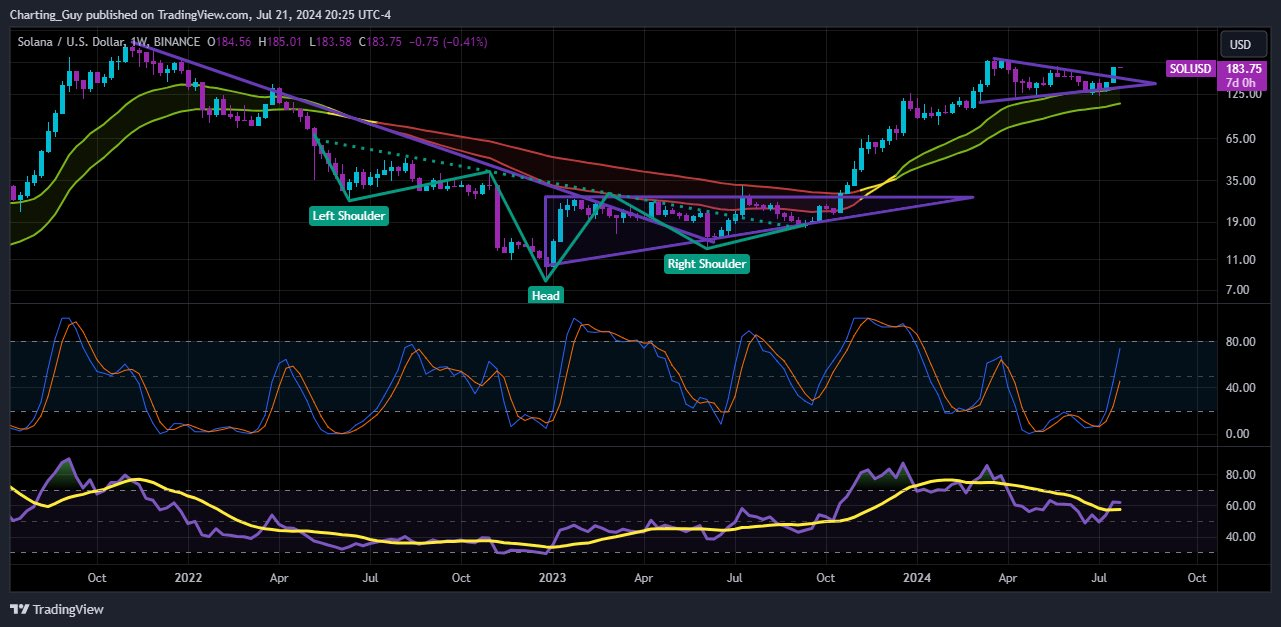
The chart illustrates Solana’s journey from its previous lows to its current high of around $183. The head and shoulders are clearly marked, showing the pattern’s completion and subsequent bullish breakout. The price now consolidates in a pennant, which often precedes a bullish rally. However, the RSI is nearing the overbought territory, and stochastic lines show the possibility for a downtrend.
Solana Traders Watch for Breakout as Bullish Pennant Pattern Signals UptrendThe moving averages show that Solana’s price has been consistently above key levels, indicating strong bullish momentum. But the price is approaching critical levels and there is possibility for a pullback.
These analyses come at a crucial time for Solana traders as its price stood at $179.53, reflecting a 4.06% increase in the 24 hours during press time. The market cap has also risen by 4.15%, reaching $83,799,315,460, with a 24-hour trading volume of $3,262,597,500, up by 75.23%. The token’s impressive rally has attracted significant attention, but the mixed signals from technical indicators warrant a careful approach.


