Recent market analyses by experts Nihilus and Captain Faibik have provided insights into potential investment opportunities in the WLD and XAUUSD markets. These analyses highlight key patterns and strategies, emphasizing the importance of careful risk management.
The price of Worldcoin (WLD) is currently $1.96, reflecting a 1.63% increase in the last 24 hours despite a 17.29% decline over the past week. With a circulating supply of over 270 million WLD, the market cap stands at $534,254,361. Nihilus, an expert on X, has shared a detailed analysis indicating a potential long position for WLD.

According to Nihilus, the WLD price has been in a clear downtrend since early July. Recently, the price has been consolidating between $2.0 and $1.9. He identifies two buyside liquidity zones: the first at $3.18-$3.19 and the second at $4.49-$4.50. He suggests a potential long position from the current consolidation area around $1.93-$1.92.
Risk management is crucial. The tight consolidation area can be used to set stop-loss levels just below $1.92. The green boxes on the chart indicate potential profit-taking zones at the buyside liquidity levels. Meanwhile, red boxes likely represent stop-loss areas to limit potential losses.
Nihilus emphasizes the importance of managing risk when considering a long position in WLD. He suggests that the consolidation area provides a reference for setting stop-loss levels. The suggested targets for the long position are the buyside liquidity zones at $3.19 and $4.49.
The expert’s strategy summary includes an entry point of around $1.93 to $1.92. The first target is set at $3.19, while the second target is $4.49. Setting a stop-loss just below $1.92 is essential to manage risk effectively. This approach helps investors limit potential losses while aiming for higher returns.
In yet another analysis, Captain Faibik shares insights on XAUUSD (Gold Spot vs. US Dollar), predicting a bullish rally with a midterm target of $2600. He notes the formation of an ascending triangle pattern, typically a bullish continuation pattern. The price has been forming higher lows, indicating buying pressure, while the highs remain relatively flat, forming resistance.
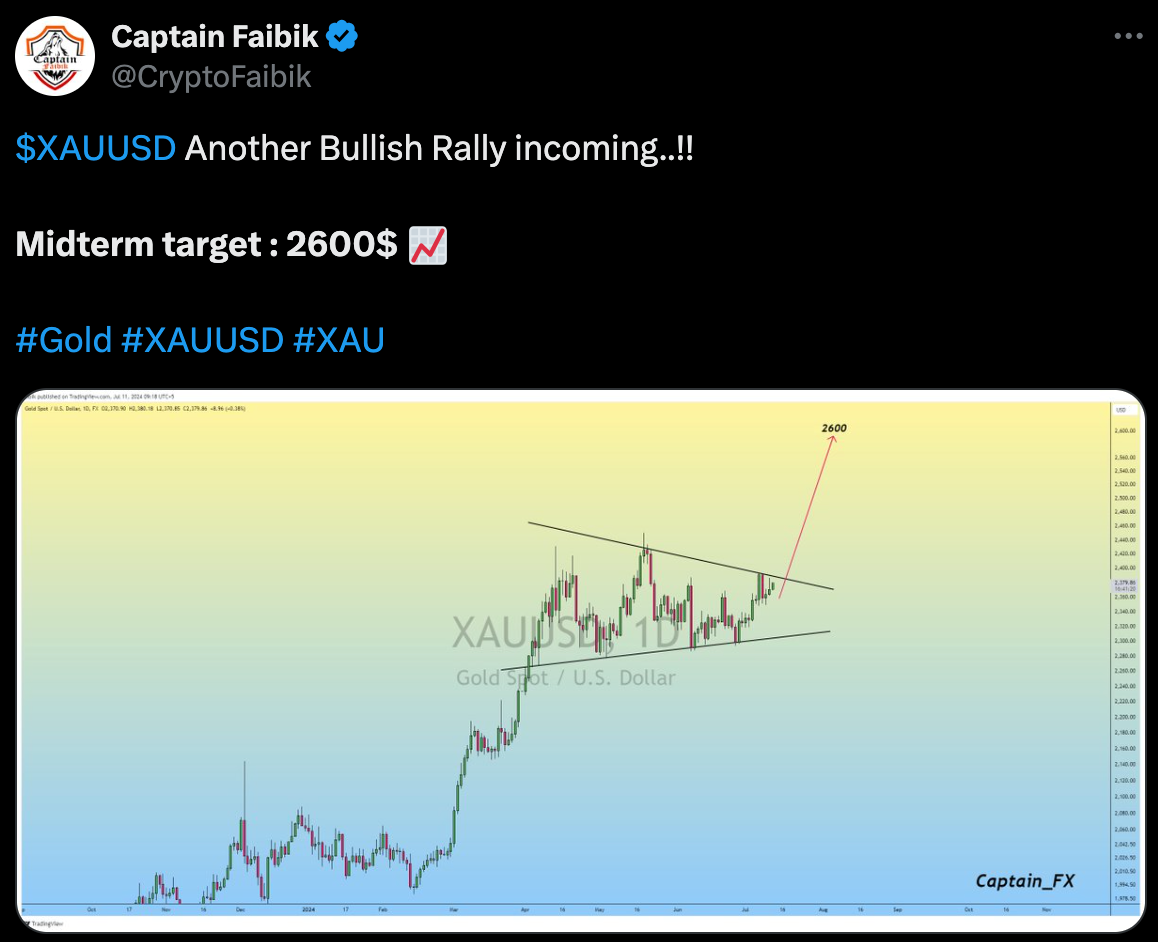
Captain Faibik suggests that a breakout above the resistance line of the triangle pattern could lead to a bullish rally. The midterm target for this potential rally is set at $2600. The current price action is near the resistance line, indicating an imminent breakout if the buying pressure continues. The recent consolidation near the upper boundary of the triangle often precedes a breakout.
The lower trendline of the triangle acts as a support level. Any pullbacks towards this line could present buying opportunities if the pattern holds. Investors should watch for these movements and consider entering long positions upon a confirmed breakout above the resistance line.