


- The analyst uncovers two pivotal catalysts in XRP’s future, foreseeing a surge in its price based on MACD dynamics and a historical downtrend pattern.
- XRP’s history reveals a singular event where a MACD and trendline alignment breakthrough led to a staggering 650x surge.
- Analysts predict a possible upward momentum for XRP, suggesting a breakthrough from its enduring six-year downtrend.
In a groundbreaking analysis, JD, a prominent crypto analyst, delves deep into XRP’s future, identifying two crucial catalysts that could catapult the cryptocurrency’s price to significant highs. In a recent X post, JD uncovered pivotal factors within XRP’s monthly chart, foreseeing a potential surge hinging these two phenomena.
#XRP – Last time MACD crossed 0 level, $XRP went PARABOLIC! Haven't confirmed above, but we are getting VERY CLOSE…
— JD 🇵🇭 (@jaydee_757) December 1, 2023
Glad we bought low using a calculated strategy! We will sell the top too using same strategy! No emotions!
Retweet/Like for updates!https://t.co/FNuFN39RjM
The analyst’s scrutiny spotlights an enduring downtrend spanning multiple years and a critical technical indicator, the Moving Average Convergence/Divergence (MACD). According to JD’s findings, when the MACD climbs beyond the 0 threshold, it historically foreshadows a substantial upswing in XRP’s price trajectory.
Nonetheless, XRP’s liberation from a descending trendline is imperative for this anticipated surge to materialize. Remarkably, the conjunction of these occurrences has occurred just once in XRP’s history, spanning from late 2013 to early 2017.
XRP’s inception in December 2013 witnessed a rapid surge to $0.06144, swiftly countered by bearish resistance, leading to a relentless seven-month downtrend. Despite intermittent resilience, XRP remained trapped in a downward spiral.
After enduring a continuous four-year decline, XRP broke the downward pattern in March 2017. This breakthrough coincided with the MACD indicator’s lines crossing above zero, causing XRP’s value to skyrocket by an astonishing 650x, reaching an all-time peak of $3.31, according to JD’s analysis.
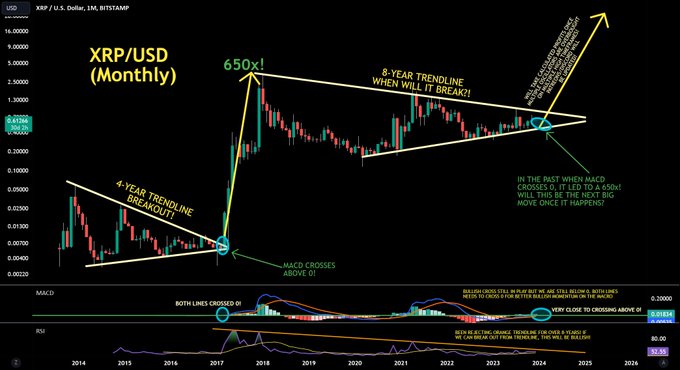
Despite this peak, subsequent opposition triggered a descent, confining XRP within the established downtrend. JD’s chart portrays an eight-year downtrend, while empirical data validates a six-year duration.
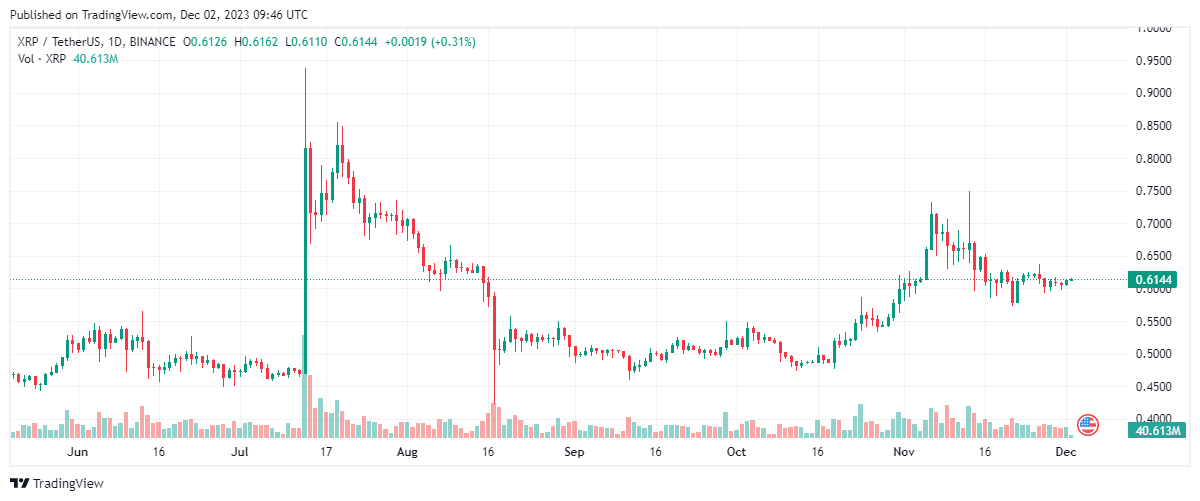
Concurrently, technical analyst Cryptoes, in a recent X post, highlighted a Cup and Handle formation, suggesting a probable continuation of the prior uptrend post a consolidation phase. However, XRP must breach the resistance at $0.64 to fortify this projection.
Massive #XRP daily cup and handle is still at play ☕️
— Cryptoes (@cryptoes_ta) December 1, 2023
Green resistance is the level we need to close above, around $0.64 | Make sure to follow to stay updated $XRP pic.twitter.com/AmqyXuyw63
The current trading price of XRP stands at $0.6138, representing a 0.28% increase over the past 24 hours. However, the cryptocurrency has experienced a 1.22% decrease in value over the last 7 days. The $0.60 price point is being met with resistance from bearish market forces.
Analysts noticed a possible change in market outlook due to ongoing chart dynamics despite the prevailing bearish sentiments. He pointed out that the MACD indicator is close to crossing above 0, which could suggest a bullish trend.
However, JD cautioned that both indicator lines must confirm this bullish crossover to be considered valid. The convergence of specific indicators may enable XRP to break out of its six-year downtrend. The analyst views this as a precursor to a significant surge, similar to the 650-fold increase.


