
- XRP’s breakout from a long-term trendline signals a potential bullish trend, but market reaction is key for confirmation.
- Recent whale activity and XRP’s modest price increase highlight the market’s volatility and unpredictability.
- Technical indicators like MACD and RSI show mixed signals, suggesting a complex future trajectory for XRP.
The cryptocurrency market is buzzing with activity as Ripple’s XRP showcases a significant pattern shift. As highlighted by JD, an analyst, after breaking out of a multi-year trendline on a non-logarithmic scale, XRP now teeters at a crucial juncture.
If the digital currency bounces off its trendline in the weekly close, it could signal a bullish trend, indicative of a breakout and retest scenario. However, slipping below this trendline might suggest a false breakout, a scenario that could trigger bearish sentiments.
This development comes amidst a flurry of activity within the XRP community. Observers and investors, often divided between skeptics and enthusiasts, are closely monitoring these market movements.
JD further pointed out that the latter group recalls XRP’s remarkable 600x surge in 2017, cautioning against premature judgments of the currency as a mere speculative bubble. This historical perspective serves as a reminder of the potential upsides in crypto investments, despite the inherent volatility and risks.
Contrasting this optimism, recent whale activities have raised eyebrows. An unknown wallet transferred a substantial 26.40 million XRP to Bitstamp, valued at approximately $16.18 million. Such large-scale movements often lead to speculation about the potential impact on XRP’s market price and liquidity. Notably, this transfer coincided with a slight price drop in XRP, aligning with a broader trend in the crypto market.
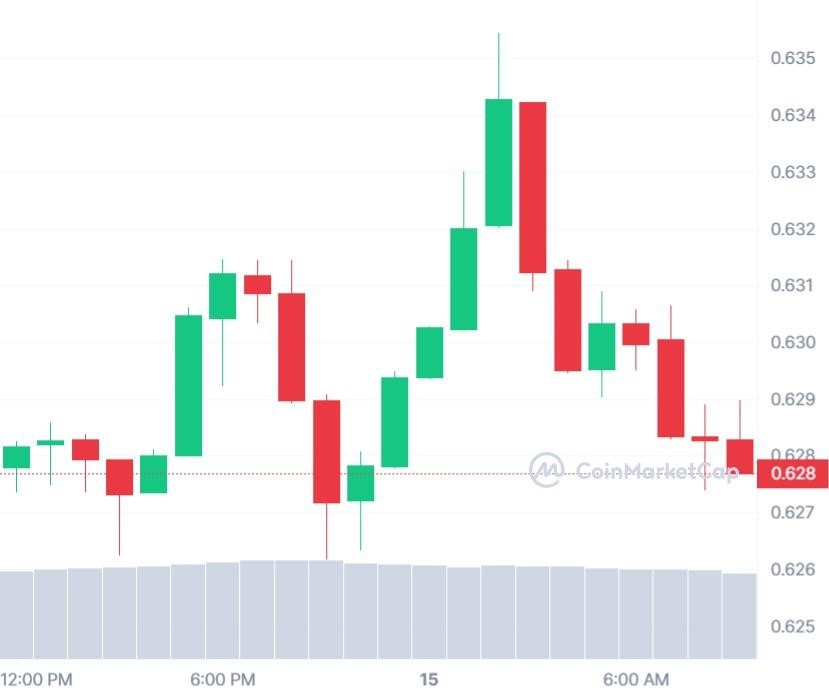
Despite these short-term fluctuations, XRP’s price has seen a modest increase over the past week. As of the latest data, XRP is trading at $0.624138, with a 0.45% rise in the last 24 hours and a 1.05% increase over the past seven days. This resilience in price underscores the dynamic and often unpredictable nature of the cryptocurrency market.
Moreover, technical indicators like the MACD (Moving Average Convergence Divergence) and RSI (Relative Strength Index) offer insights into market sentiment. The current MACD suggests a bearish momentum, while the RSI indicates a neutral stance, neither overbought nor oversold. These indicators, along with the observed whale activities and historical trends, paint a complex picture for XRP’s future.
XRP’s market behavior is a testament to the volatile and speculative nature of cryptocurrencies. While the recent breakout from a long-term trendline offers a glimmer of optimism, the market’s reaction in the coming days will be crucial in determining whether this is a sustained bullish trend or a mere anomaly. Investors and observers alike are advised to stay vigilant, as the cryptocurrency market continues to evolve and surprise.