


- XRP consolidates for 20 days in a $0.56-$0.62 range, signaling a potential breakout soon.
- XRP volatility drops below 2017 levels, pointing to a possible significant price movement.
- XRP’s 20-day consolidation could lead to a major breakout as volatility continues to fall.
XRP holders are closely monitoring the cryptocurrency as it continues to trade within a tight range for over 20 days. According to an analysis shared by XRP Captain, an influential figure on X, the digital asset has been stuck in a sideway consolidation between $0.56 and $0.62 on the 4-hour XRP/USD chart from Bitstamp. While this sideways movement might seem uneventful, it signals a buildup of momentum. Market watchers expect an explosive breakout once the price moves decisively beyond this range.
Narrowing Price Range
The consolidation phase in XRP’s price has created a clear support level at $0.56, with a resistance barrier at $0.62. The chart indicates that neither bulls nor bears have been able to gain control over the market during this period.
With steady trading activity shown by a volume of 228.263 million, price movements have been confined within a 1.70% decrease over the 20-day period. Notably, such tight ranges are often precursors to significant breakouts as buyers and sellers accumulate positions. A break above resistance could trigger a rally, while a dip below support could see prices fall further.
Volatility Falls Below 2017 Levels
Recent long-term data, as pointed out by Mikybull Crypto, has revealed a sharp decline in XRP’s volatility, with levels now lower than those seen before its historic 2017 rally. Bollinger Bands, a key indicator of price volatility, have narrowed significantly between 2023 and 2024. This contraction is a crucial signal that a breakout may be imminent, as similar patterns in 2017 and 2020 resulted in explosive price movements.
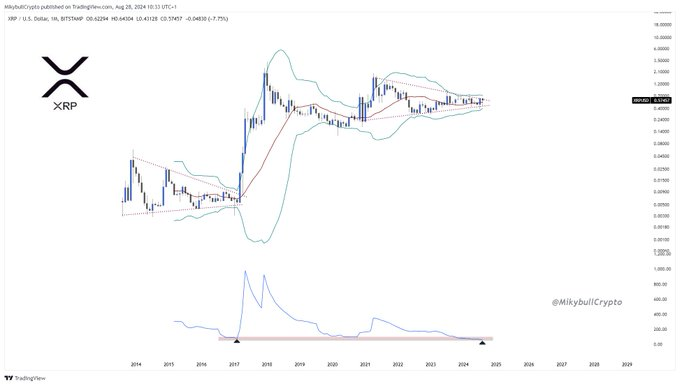
However, it remains to be seen whether the upcoming breakout will follow a similar trajectory. If a bullish trend unfolds, resistance levels near $1.30 could be tested, while bearish scenarios could push the price toward $0.40 or lower.
Breakout Could Mimic Historical Patterns
XRP’s historical behavior suggests a pattern of parabolic price action following periods of low volatility. The chart illustrates how the previous contractions in volatility led to significant upward price movements, with XRP experiencing rapid gains in both 2017 and 2020.
XRP Faces Possible Pullback Amid Broader Market UncertaintyShould this pattern repeat, XRP could potentially challenge its all-time high near $3.40. However, if broader market sentiment turns negative, the asset could re-test lower support levels, potentially slipping to $0.25 or beyond.


