


- XRP price encounters resistance at $0.62, signaling a potential for market reversal.
- Technical indicators suggest a cautious market for XRP with signs of accumulation.
- XRP forms an ascending triangle, hinting at possible upward trend continuation.
XRP encountered resistance at the critical $0.62 mark, halting its upward trend. This resistance level has proven significant, thwarting further gains for the cryptocurrency. As a result, XRP’s price dipped below the $0.60 mark, a key level closely watched by traders. The setback led to a bearish sentiment, causing the price to retreat from the recent highs.
Currently, XRP has been oscillating between $0.44 and $0.65, indicating a period of consolidation over recent weeks. Despite these fluctuations, the potential for a major breakout remains if it follows historical patterns. This week, XRP showed a promising rise of nearly 2%, signaling a potential turnaround from its sideways trading pattern.
Over the past 24 hours, XRP has been trading in a range of $0.6057 and a low of $0.5928, indicating volatile market movements. At the time of writing, the XRP price hovered at $0.5942, slightly dipping from its earlier positions. The bulls and bears are actively contesting the direction of XRP’s next significant move, reflecting the ongoing uncertainty in the market dynamics.
On the technical front, XRP forms an ascending triangle pattern on the 24-hour chart, a bullish market signal. If XRP can overcome the immediate resistance level, this pattern suggests continuing the upward trend. The next significant resistance is at $0.62, marked by a double top pattern that could pose a challenge for further gains.
XRP Could Hit $7.5 as Analysts See Breakout PotentialIn mid-July, a surge in daily active addresses coincided with the SEC case verdict, though this activity has since diminished. Network growth, however, has shown a modest increase since June. The sharp price decline in early August led to a rise in the mean coin age, indicating ongoing token accumulation. Concurrently, low dormant circulation suggests limited token movements, minimizing the potential for significant selling pressure.

Despite a positive short-term MVRV indicating slight profits for holders, these gains were substantially curtailed by profit-taking and a shift in market sentiment back in mid-July. This analysis points to a cautious but accumulating market, reflective of a broader, cautious optimism among investors.
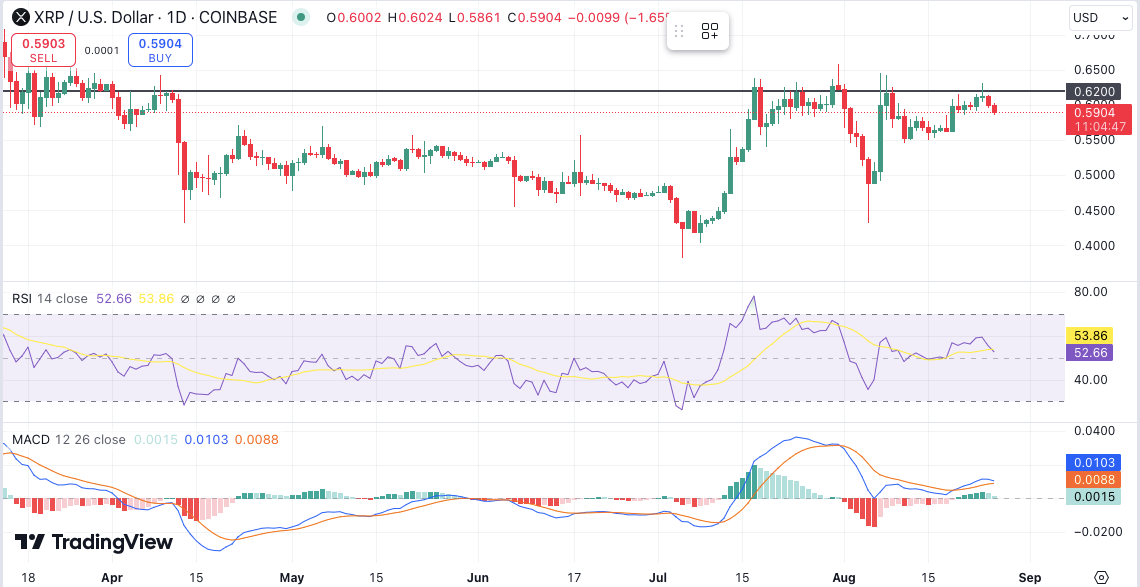
The daily technical indicators for XRP show a continuing fluctuation pattern without a clear breakout or breakdown. The Relative Strength Index (RSI) is positioned at 52.66, suggesting a neutral momentum without immediate signs of overbought or oversold conditions. The Moving Average Convergence Divergence (MACD) indicates a marginal bullish signal. The MACD line (blue) is just above the signal line (orange), albeit the difference is minimal.


