
XRP exhibits bearish divergence despite its significant rally in the past couple of weeks. However, this divergence is being challenged by strong support at the lower end of its trading range. The recent price pattern could be a sign that XRP is building up momentum for an even bigger move as it attempts to break above its 20-MA on the weekly time frame.
Ripple is showing extreme similarities with its previous ATHs in terms of price and time frame. This could indicate that December 20, 2023, could be fireworks for XRP as it may reach its all-time highs again. Ripple’s daily chart trading session is currently forming an A-Box-like pattern which signifies that the asset may be ready for a breakout soon.
Ripple closed above the Moving Average MA 20 on the weekly timeframe, which is bullish and shows strength and momentum. Despite the recent pullback, Ripple is still trading above the Exponential Moving Average50, which could provide a strong support level going forward and will be an important factor in deciding the future direction of XRP.
Ripple’s Current Price Analysis
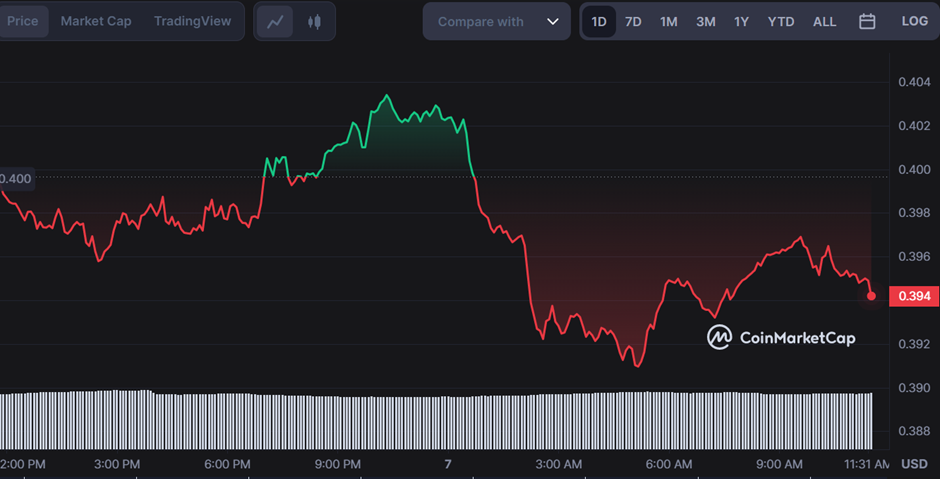
Ripple’s recent price analysis indicates XRP/USD opened the daily chart on a bullish note, reaching a daily peak of around $0.4034 before falling sharply towards a dip of $0.391.
As of now, the asset has recovered from this low and is trading just near the $0.4 level. Ripple is trading at $0.395, down by 1.19%at the time of writing.
XRP is currently trading in a range between the $0.39-$0.414 levels, and it needs to break out of these support/resistance levels to determine its next direction of movement. The MACD Histogram is also negative, suggesting a bearish outlook for XRP.
However, if XRP can break out above $0.4 and close above the Moving Average of 20 in the weekly timeframe, this could be bullish news for investors as it would signal renewed strength and momentum in Ripple’s price.
The recent bullish sentiment is slowly fading as the momentum oscillators used to measure the strength of the price action are turning bearish, suggesting that XRP may be ready for a pullback.
For instance, the Awesome Oscillator is in bearish mode, and the Relative Strength Index is also headed lower, indicating that selling pressure may be building up.
Currently, XRP is trading within a range and needs to break out of this to determine its direction of movement. The key resistance level to break is the Fibonacci 38.2% at $0.414, and the support level is the Fibonacci 23.6% at $0.39. A move above this resistance could push XRP towards its next target of $0.43, while a breach below the support level may take it down to $0.37 in the near term.
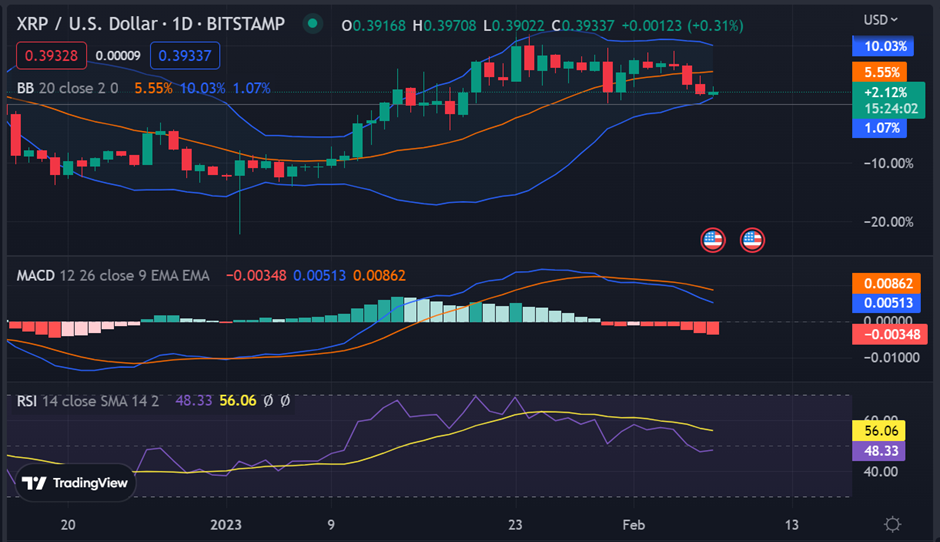
Ripple price is consolidating inside a rangebound structure, and if it can break out of this range, we might see XRP retest its previous peak soon. The Bollinger bands on the daily chart indicate moderately high volatility in the market. The 50 DMA is also trending upwards, showing that XRP could be headed higher in the near future.
A breakout is imminent, and if XRP can break out above the $0.414 resistance level, it could signal further upside in Ripple’s price, and investors can look forward to a return on its previous ATH levels soon.
Moreover, XRP is building a base for a decisive move as it attempts to close above 20 MA weekly. If history were to repeat itself, we could see massive gains for XRP by December 2023 as it reaches its all-time highs.