


- XRP is anticipated to enter a significant bull run in 2024-2025, driven by the decline in Bitcoin dominance.
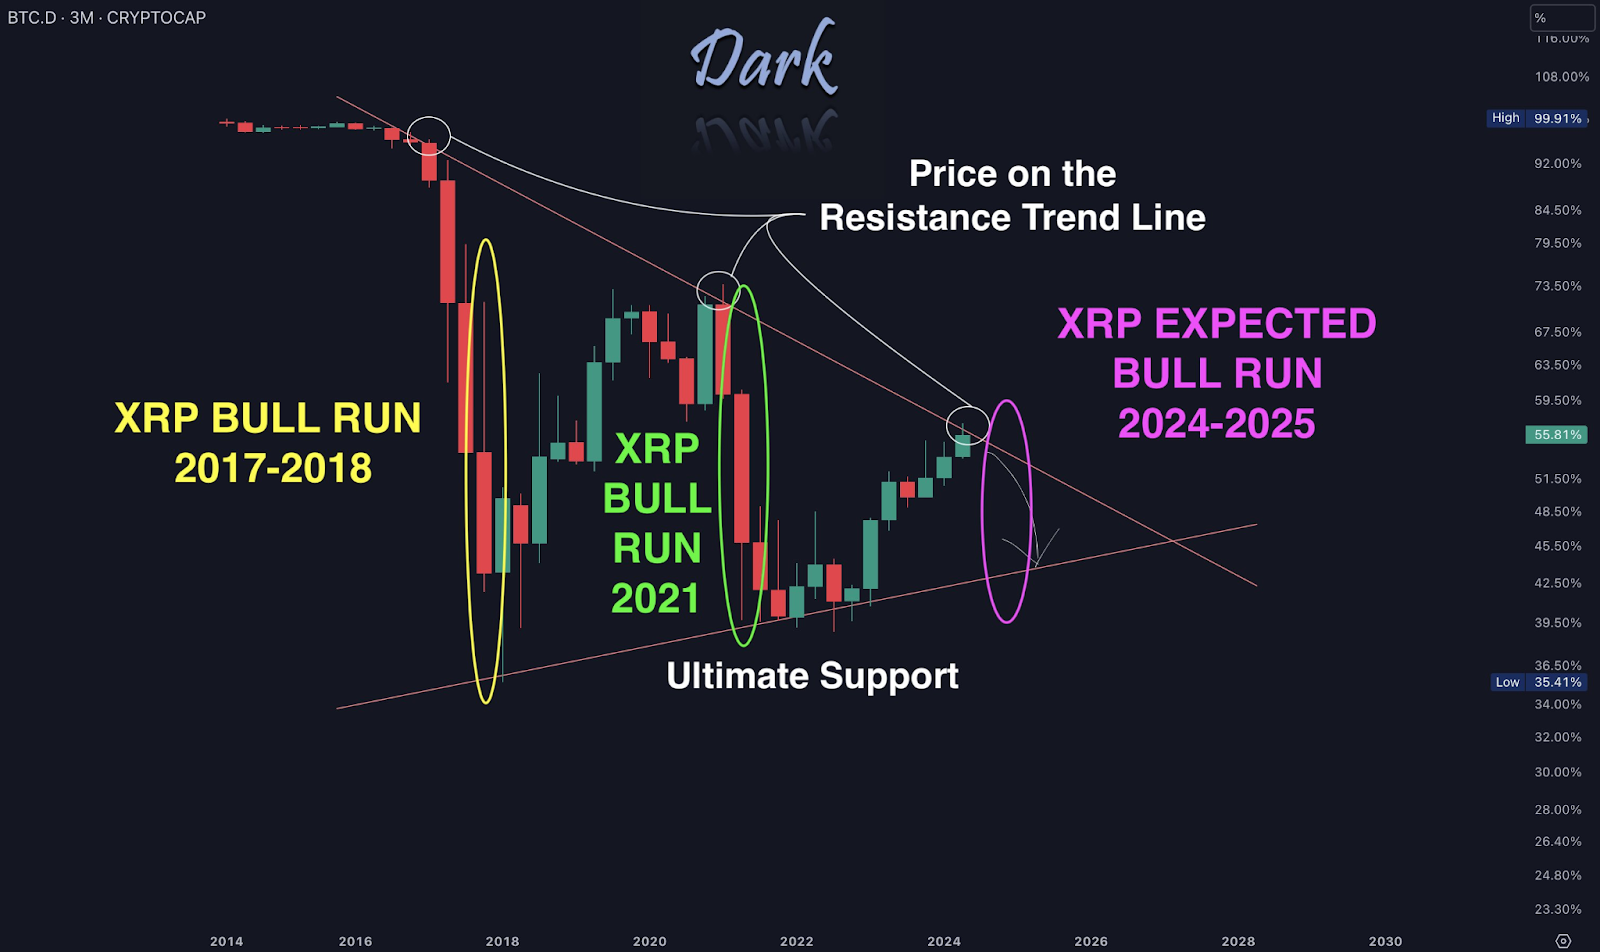
- Bitcoin dominance is expected to drop from its current level of 56% to 44% by the end of the year.
- The XRP token shows resilience amid a bearish market, with technical indicators suggesting a potential bullish reversal.
According to market expert Dark Defender, the XRP/BTC pair has reached a crucial support level, indicating a potential reversal. Dark Defender highlights that the shift is anticipated to lead XRP into a bullish phase, much like the bull runs witnessed in 2017-2018 and 2021.
The Bitcoin Dominance chart reveals a critical trend. The 3-month candle chart shows that Bitcoin’s dominance has consistently faced rejection at the ultimate resistance line since 2016. Currently, Bitcoin’s dominance stands at 56%, but it is projected to decline to 44% by the end of the year. This decrease in Bitcoin dominance is expected to catalyze the XRP bull run.
Dark Defender analysis highlights the significance of these technical patterns. The XRP/BTC pair standing on the support level suggests a strong potential for a market reversal. As Bitcoin dominance weakens, XRP is likely to gain momentum, driving its price upward.
Historically, lower Bitcoin dominance has often led to altcoin surges, benefiting cryptocurrencies like XRP. This anticipated market behavior aligns with previous bull runs, where XRP saw substantial gains. The patterns observed in the Bitcoin dominance chart and the XRP/BTC pair provide a strong foundation for predicting an upcoming bull run for XRP in 2024-2025.
Looking at XRP’s market performance, the digital asset is trading on a bearish note amid the broad market downturn. XRP has been trading on a downward trajectory over the past 24 hours, losing over 1% as the bears have outshined the bulls. As of press time, XRP is exchanging hands at $0.5140.
Despite the current bearish outlook, XRP has showcased market resilience over the past week despite the market volatility. XRP climbed from the $0.4979 region only to face stiff rejection at the $0.5300 mark, correcting again toward $0.5000. The market capitalization and the trading volume stand at $28 billion and $757 million, respectively.
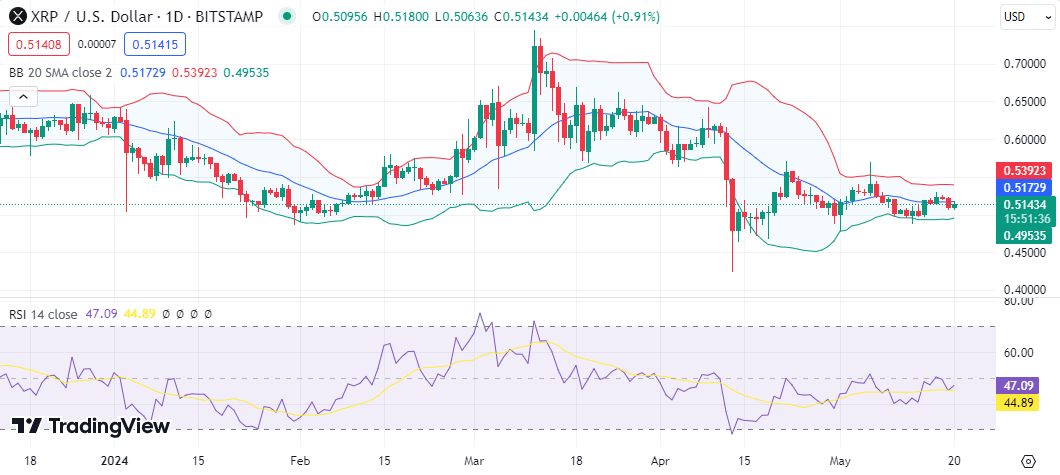
Technical indicators on the daily chart show a neutral market with an impending bullish reversal. The Relative Strength Index (RSI) indicator is climbing toward the neutral region with a value of 44, suggesting an increase in buying pressure. In addition, the Bollinger Bands have reduced in size, indicating a decrease in volatility with a breakout toward the upper band as the green candlesticks form.


