The recent price fluctuations of Ripple’s XRP, primarily driven by misinformation, have once again highlighted the inherent volatility in the cryptocurrency markets. In particular, the price of XRP saw a significant increase on November 13, rising to $0.75. A widely circulated but unsubstantiated rumor on social media platform X (previously known as Twitter) regarding BlackRock’s XRP exchange-traded fund (ETF) debut caused this increase.
Will #XRP turn bullish soon? https://t.co/ndtYEzCxCa
— AMBCrypto (@CryptoAmb) November 16, 2023
The rumor suggested that BlackRock had filed for an “iShares XRP Trust.” However, this news was later debunked as false by Bloomberg analyst Eric Balchunas, leading to a swift reversal in XRP’s price trend and the loss of its 12% gain almost as quickly as it had been acquired.
Market analysts have quickly pointed out that the prospect of an altcoin ETF remains a distant reality. Consequently, the impact of such rumors seems more pronounced due to their implausible nature.
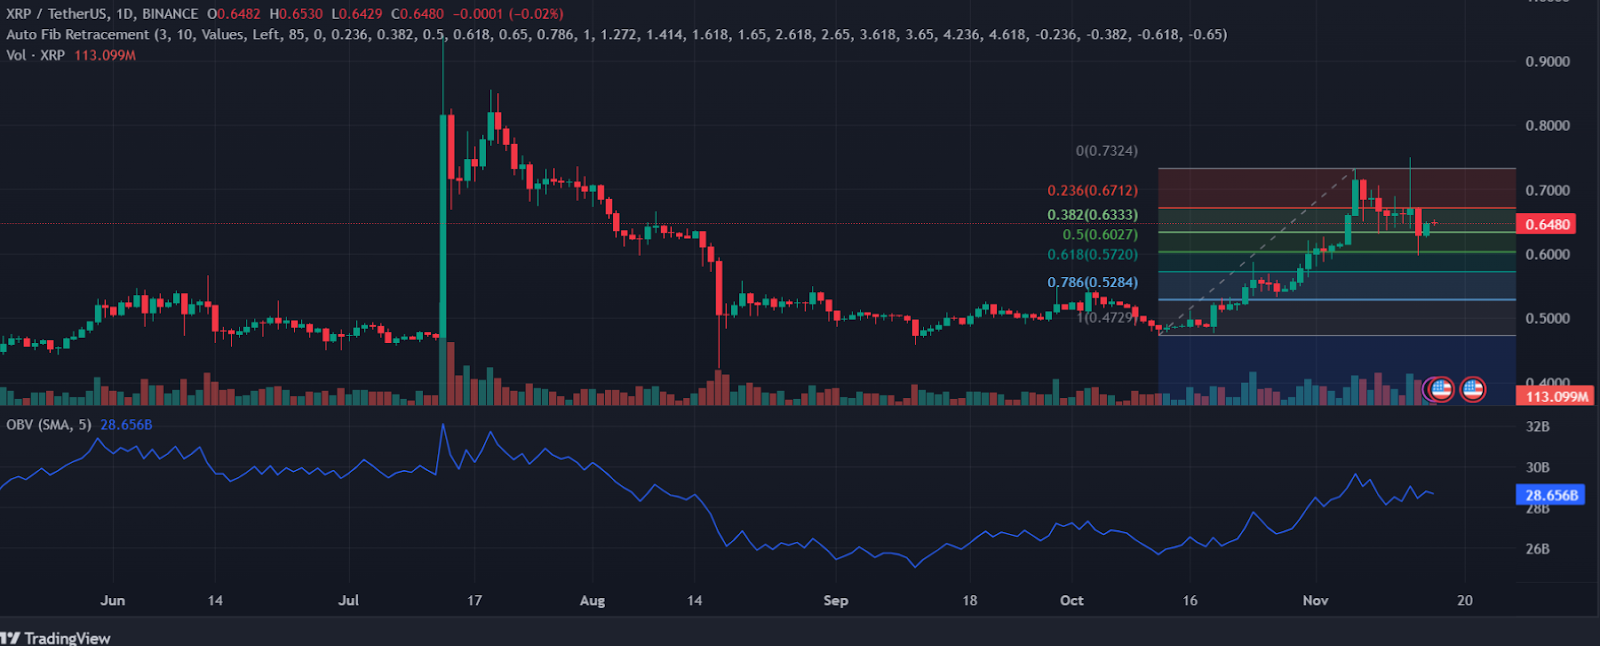
A daily technical analysis of XRP’s price movement offers exciting insights into these dynamics. The daily candlestick charts present a picture of mixed market sentiment for XRP, with red and green candlesticks indicative of bearish and bullish sentiments, respectively. Notably, the price found some support at the 0.5 Fibonacci retracement level but encountered resistance at the 0.236 level.
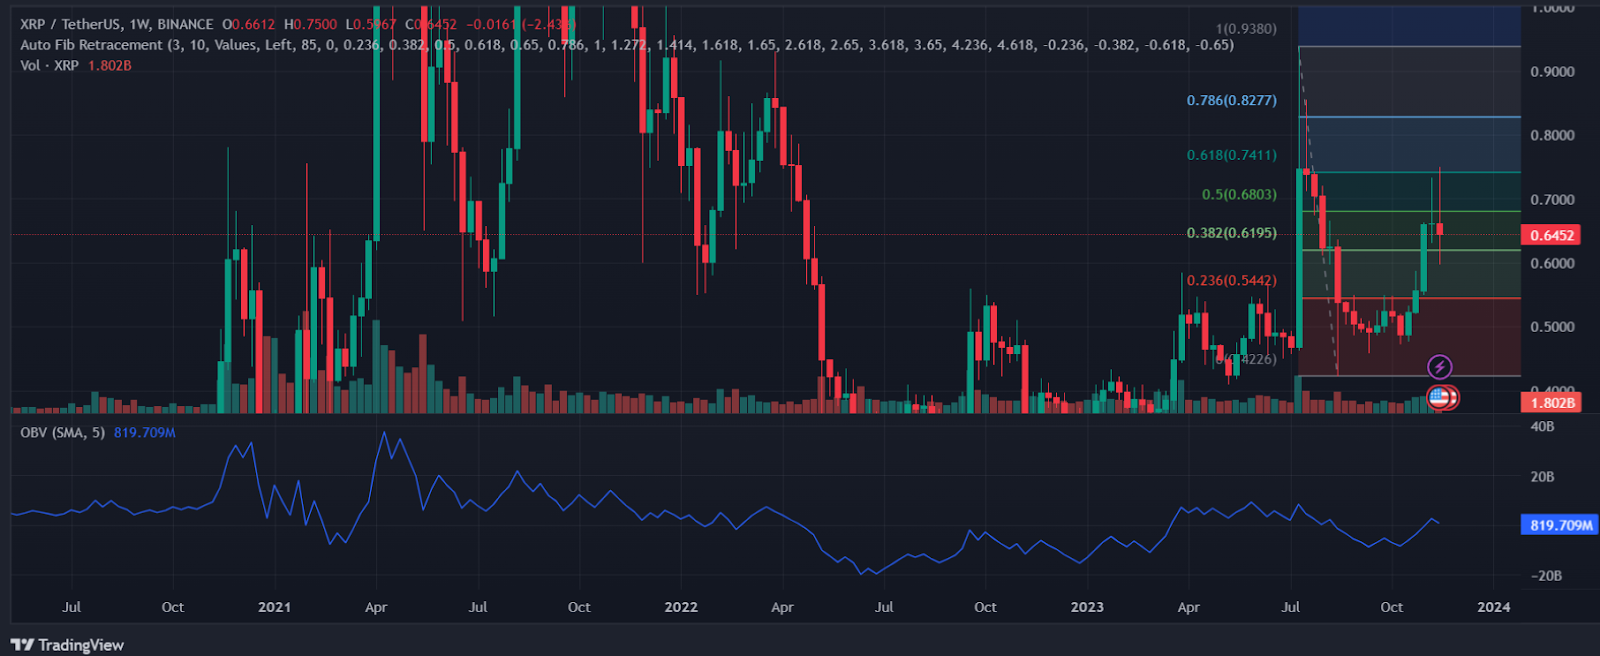
Moreover, the Relative Strength Index (RSI) stands at a neutral 52.22, suggesting a balance between buying and selling pressures. On the other hand, the On-Balance-Volume (OBV) indicator’s upward trend implies a prevailing buying pressure, which might indicate bullish sentiment. However, a recent red candlestick on the weekly chart suggests a short-term bearish sentiment despite having a smaller body than the preceding green candlestick.
Further insights into XRP’s price behavior can be gained from analyst EGRAG CRYPTO’s research that unfolded several crucial elements. It shows significant price levels: 0.55500000 as a likely support or target level, 0.78519947 as a potential future resistance or target price, and 1.54267361, marked “To Valhalla,” indicating a significant upward movement.
#XRP Game Time: Join the Fun! 🎮
— EGRAG CRYPTO (@egragcrypto) November 16, 2023
Whoever gives the best breakdown of the chart below wins 300 #XRP! 📈
I'll pick 1️⃣ or 3️⃣ based on replies and quality! 🏆#XRPArmy STAY STEADY, I truly believe we'll emerge victorious. pic.twitter.com/Ln5NMiuiBJ
The chart also features colored trend lines, with green arrows suggesting upward movements and red arrows pointing to downward trends. Additionally, it includes various technical analysis structures like support/resistance zones, trend lines, and a possible breakout pattern.
The trading volume indicated as relatively low (Vol.10.225K) suggests either a low-liquidity market or a snapshot taken during a period of intense activity. The main chart area, denoting each day’s trading activity with candlesticks, shows green and red bodies when the price closed higher or lower than it opened, respectively.
Traders rely heavily on such charts because they provide crucial insight into price behavior in the past and present. However, it is essential to remember that these forecasts are speculative and involve risks, stressing the importance of caution in the volatile and erratic cryptocurrency market.