


- XRP’s ascending triangle pattern from 2021 hints at a potential breakout.
- Elliott Wave analysis shows XRP in a corrective wave pattern.
- XRP trades at $0.5277, down 1.40% in 24 hours but up 2.84% in 7 days.
XRP, the native cryptocurrency of the Ripple network, has been a subject of interest for investors and analysts alike. Recently, a post on the X platform by Dark Defender highlighted critical insights into XRP’s price trends using the Fibonacci Spiral and Elliott Wave Theory. This article delves into the historical and recent price trends of XRP, analyzing patterns and market behavior from 2014 to 2024.
XRP’s price history can be segmented into distinct phases. From 2014 to late 2017, XRP/USD demonstrated relatively low volatility, consistently trading below $0.50. This period was marked by a gradual accumulation phase where price movements were relatively subdued.
In late 2017, XRP experienced a significant surge, part of a broader cryptocurrency market rally. This bull run saw XRP reach an all-time high near $3.50 in early 2018. However, this rapid ascent was followed by a sharp correction. By 2018, XRP’s price retraced to sub-$0.50 levels, where it stabilized and traded mostly within the $0.20 to $0.50 range up until 2020.
From 2021 onwards, XRP/USD formed an ascending triangle pattern, a bullish continuation pattern characterized by higher lows and relatively consistent highs between $0.75 and $1.50. This pattern is delineated by a red resistance line and a blue support line, indicating potential breakout points.
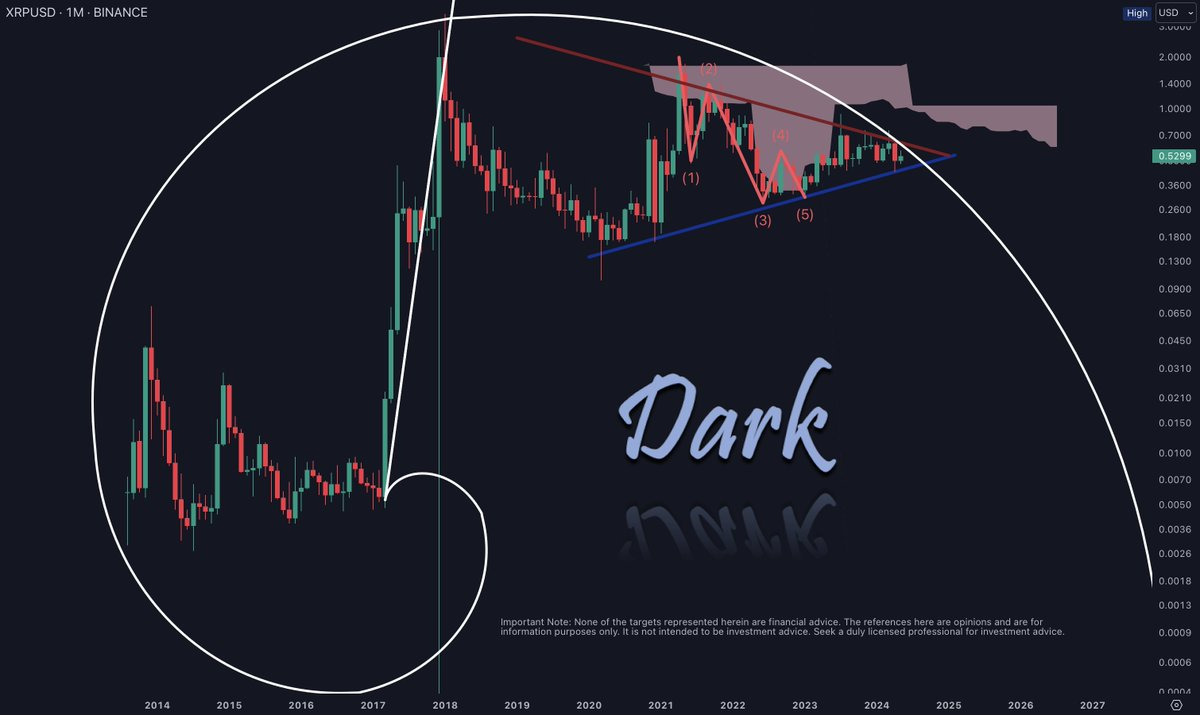
Additionally, the chart suggests an Elliott Wave formation within this ascending triangle. The waves, labeled (1) through (5), indicate a corrective wave pattern. This wave analysis helps in understanding potential future price movements, suggesting that the price may undergo further consolidation before any significant breakout.
XRP May Surge to $154 Despite Slow Growth, Analyst SuggestsAs of today, XRP is trading at $0.5277, with a 24-hour trading volume of $623,894,097.19. This represents a 1.40% decline in the last 24 hours but a 2.84% increase over the past 7 days. XRP’s market capitalization stands at $29,188,129,975, with a circulating supply of 55 billion XRP.
Despite the recent 2.84% price increase, XRP is underperforming compared to similar cryptocurrencies within the FTX Holdings group, which have seen an 11.40% rise. However, XRP is outperforming the broader global cryptocurrency market, which has remained flat over the same period.
Dark Defender’s analysis emphasizes the significance of the Fibonacci Spiral in linking price and time analysis for XRP. This tool, combined with the observed Elliott Wave patterns, provides a framework for predicting future price movements. The completion of the Elliott Wave pattern within the ascending triangle could signal a potential breakout, leading to a new phase of price discovery.


