


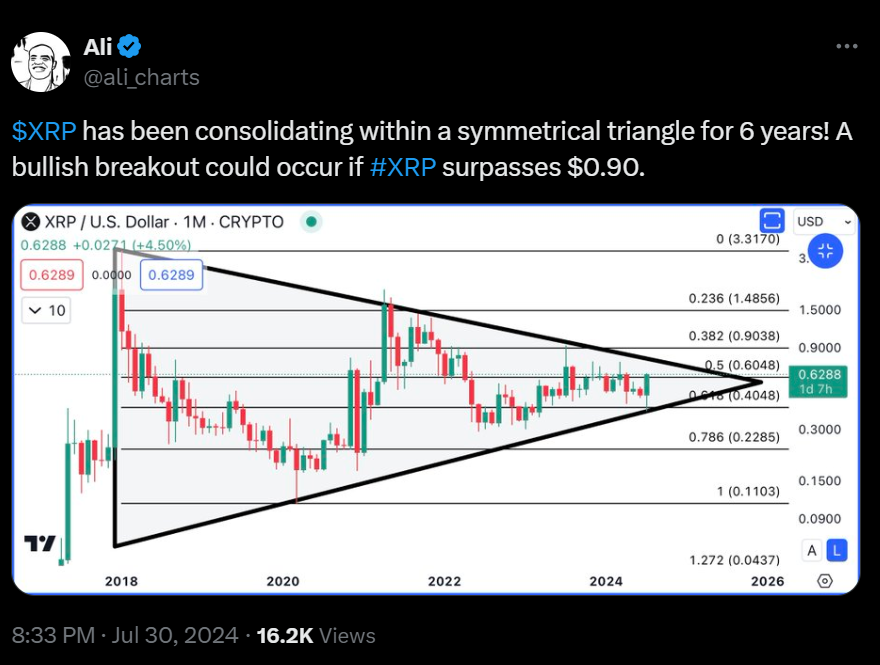
- XRP consolidates in a 6-year symmetrical triangle, potential breakout above $0.90 could drive bullish momentum.
- Key support at $0.4048 and $0.2285; resistance at $0.9038 and $1.4856, pivotal for XRP’s next move.
- XRP’s price action shows bullish momentum as highlighted by analysts like Ali Martinez and ZAYK Charts.
XRP has been consolidating within a symmetrical triangle for six years, hinting at a potential bullish breakout. As highlighted by crypto analyst Ali Martinez, if XRP surpasses $0.90, it could spark significant upward momentum.
Analyzing the XRP/USD price trend on the 1-month chart reveals key support and resistance levels based on Fibonacci retracement levels and the symmetrical triangle pattern. These technical indicators provide insights into potential price movements.
Support levels include the 0.618 Fibonacci level at approximately $0.4048, which has served as a substantial support area in the past. This level has often acted as a base for price consolidation. Additionally, the 0.786 Fibonacci level, around $0.2285, represents a deeper retracement and has historically provided support during downturns.
Resistance levels include the 0.382 Fibonacci level, situated at around $0.9038, a critical resistance point where the price has encountered selling pressure previously. Furthermore, the 0.236 Fibonacci level, approximately $1.4856, signifies a higher resistance zone where the price could face significant selling pressure if it breaks above the current range.
The symmetrical triangle pattern on the chart indicates a consolidation phase, characterized by higher lows and lower highs converging towards an apex. A breakout above the triangle’s upper trendline could signal a bullish move, potentially targeting the 0.382 and 0.236 Fibonacci levels as resistance. Conversely, a breakdown below the lower trendline could suggest a bearish move, with the 0.618 and 0.786 Fibonacci levels serving as potential support areas.
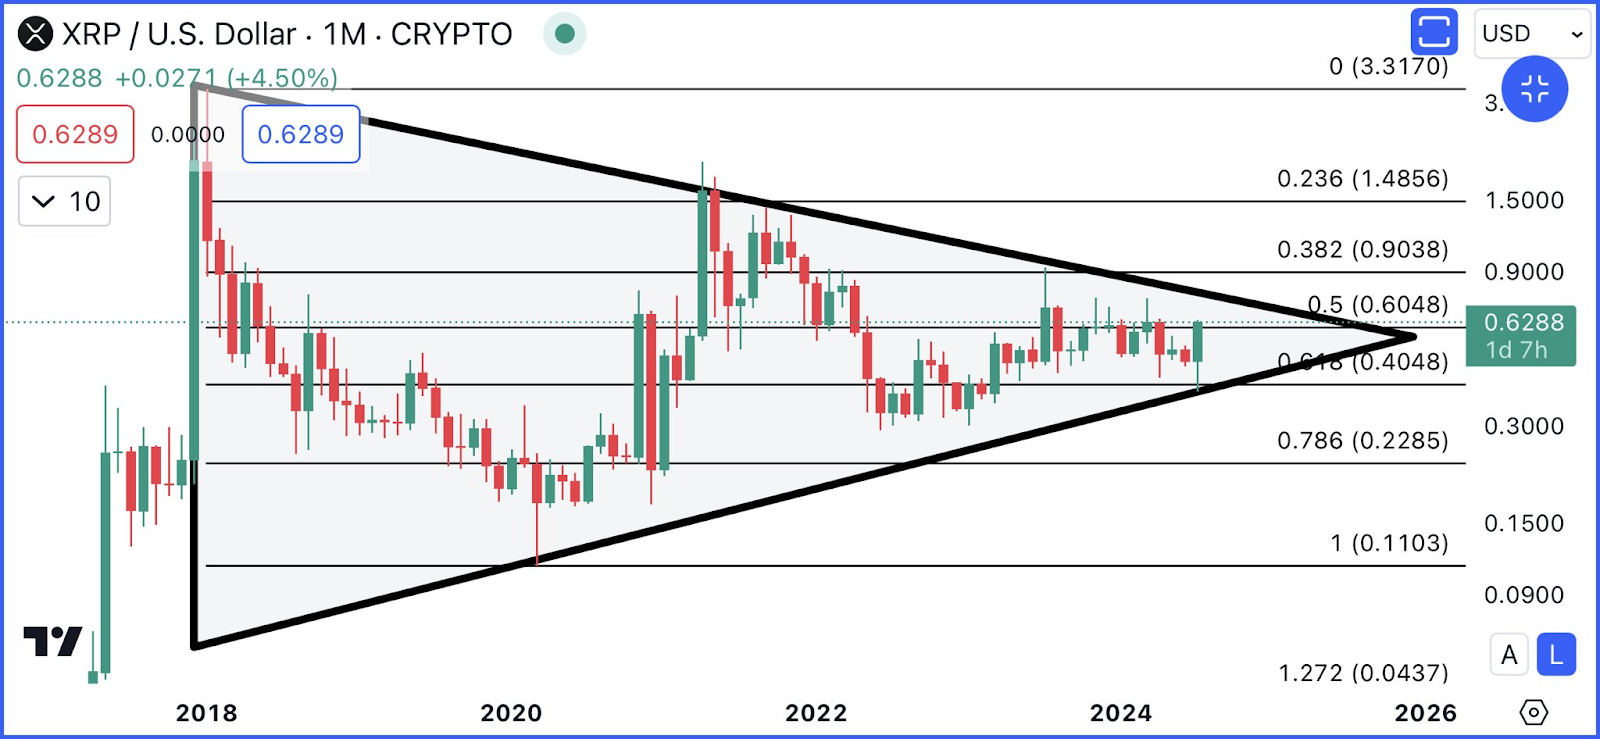
As per the chart, XRP is priced at approximately $0.6288, slightly above the 0.5 Fibonacci level at around $0.6048. This level represents a pivotal point in the price action. If the price maintains its position above this level, it may attempt to break above the upper trendline of the symmetrical triangle, leading to a potential bullish breakout. Conversely, if the price falls below the 0.5 Fibonacci level, it could retest lower support levels, particularly around the 0.618 Fibonacci level.
Ripple’s Legal Battle Heats Up: Whales Buy $84M in XRP Amid Settlement SpeculationsZAYK Charts, an analyst, further analyzing the 4-hour chart for XRP/USDT, identified an ascending trendline breakout as expected. This trendline has been respected multiple times, indicating strong bullish sentiment as long as the price stays above it. Additionally, a horizontal support level around $0.6200 has emerged, with the previous resistance now turned into support.

Resistance levels include a horizontal resistance zone around $0.6600, which has historically acted as a significant barrier. A breakout above this level could trigger further bullish movement. The projected target resistance level, based on the breakout, is approximately $0.7400, representing an 18.58% increase from the breakout level. The price trades at around $0.6497, reflecting bullish momentum.
A successful breakout and retest of the $0.6200 support level strengthened the bullish case, with the price likely aiming for higher resistance levels. XRP is up 7.14% in the last 24 hours, with a price of $0.641801 at press time and a 24-hour trading volume of $2,830,422,733.


