10 Chart Patterns Every Crypto Trader Needs to Know
The crypto market is known for its volatility and the risks associated with investing. Yet, smart money players and other traders try to profit from the market chaos by analyzing the chart and performing technical analysis. Following the candle sticks and understanding their paths would give a clearer picture of the price trends.
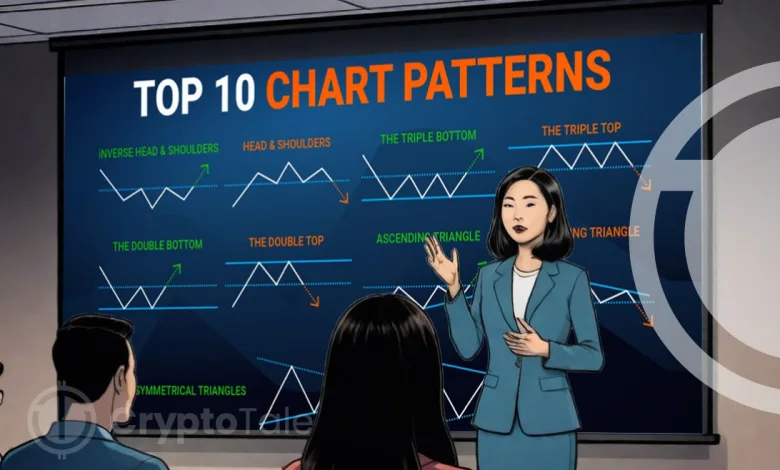
The candles on the chart often align with some defined patterns. Investors and traders need to closely watch those patterns to profit from the volatile market. Whether you are a beginner or a seasoned trader, here are the 10 common crypto chart patterns that you need to know.
1. Head and Shoulders
Head and Shoulders reversal chart patterns indicate the reversal trend from bullish to bearish. It is one of the most common patterns used to determine the end of an upward trend. The pattern is noticed by three upward peaks, where the middle peak (highest) is the head, and the two side peaks are the shoulder, forming the head and shoulder pattern.
This type of pattern is formed when the prices of cryptocurrencies peak and fall back to the same support level known as the ‘neckline.’ When all the peaks return to the same neckline, it indicates a downward trend, and the point where the third peak meets with the neckline is an ideal entry point for traders.

2. Double Top
Double Top is one of the more commonly used patterns to identify trend reversal. This pattern indicates a strong bearish sentiment after an upward movement in the chart. The initial peak ascends to a specific height above the neckline before receding back to the neckline. Subsequently, the second peak mirrors the height of the first peak before descending to the neckline. On the chart, the pattern of the double top will look like ‘M.’ A bearish trend can be confirmed if the price goes below the support level or neckline.

3. Double Bottom
Double Bottom is a common crypto bullish reversal pattern that indicates the end of selling pressure and a shift toward an upward trend. This pattern entails the asset’s price dipping below a resistance level, reaching a support level, and rebounding back toward the resistance level. Subsequently, the price retraces back to the support level before initiating another ascent towards the resistance level. On the chart, the double bottom pattern will look like ‘W,’ and the bullish momentum will be confirmed when the price breaks through the resistance level.

4. Ascending Triangle
The ascending triangle is a crypto pattern indicating a continuous bullish trend. To mark this pattern on the chart, a horizontal line is drawn along the swing highs (resistance), comprising two or more highs at the same level. Another horizontal line is drawn along the swing lows (support). The intersection of these lines forms a triangle on the chart, defining the trend line. The trend line indicates the breakthrough of the resistance level and a further upward trend.

5. Descending Triangle
The descending triangle, unlike the ascending triangle, represents a continuous bearish trend. In these situations, traders usually enter short positions to make profits from the falling market. In order to mark the descending triangle pattern on the chart, draw a horizontal line along the swing lows (support) and aline along the descending swing highs (resistance). The candlestick at the intersection signifies the potential breakout point where the trend is expected to breach the support level and continue downward.

6. Symmetrical Triangle
The symmetrical triangle is a chart pattern that indicates either a bullish or bearish market trend. It is characterized as a continuous trend implying that the market’s ascent and descent will progress steadily within the triangle boundaries without abrupt changes in direction. The triangle is formed by drawing a line along a series of swing highs (resistance) and another line along the swing lows (support). The direction of the candlestick at the convergence point determines the trend of the symmetrical triangle, and the market tends to break in that direction. If there’s no clear indication of direction or trend after the triangle forms, the market could move in either direction, which is termed a bilateral pattern.

7. Rounding Top and Bottom
Rounding top and Rounding bottom are crypto reversal patterns that signify changes in upward and downward trends in the chart. In a rounded top, the buying sentiment tends to be high at the beginning. Following this, the trend will rise from the support level, gradually reaching its peak before declining back to the initial support level. After reaching the neckline, it will break out, leading to a downward trend. The pattern will take the shape of an inverted ‘U.’

In a rounded bottom, the starting trend will be downward, and the trend will gradually change to upward. From the resistance level, the price gradually declines and reaches a low point. Following this, the price gradually increases and reaches the resistance level. Once the resistance level is reached, a breakthrough occurs, initiating an upward trend. The pattern will take the shape of a ‘U.’

8. Wedge Pattern
A wedge is a price pattern where two trend lines, resistance, and support, contract to form a narrower price range. The wedge can either be a rising wedge or a falling wedge. When the support line is steeper than the resistance line, it is called a rising wedge. It signifies that the price will break through the support level, and the market trend will turn bearish.
On the contrary, if the resistance level is steeper than the support level, it is called a falling wedge pattern. It indicates that the price will break through the resistance level, and the market will turn to a bullish trend. The wedge pattern is a reversal pattern where the bullish and bearish trend is determined.

9. Cup and Handle
The cup and handle pattern is a bullish continuation pattern where there is a short bearish period in the middle, followed by a continuation of the overall trend, which is the bullish trend. The ‘Cup’ is similar to the rounding top pattern and is followed by a ‘handle,’ which is similar to the wedge pattern. After consolidating between the cup patterns, the price would fall. The fall in price is indicated by the handle pattern. After completing the cup and handle pattern, the market would enter a bullish phase. The handle pattern can be considered as the ideal time for traders to enter the market.

10. Pennant or Flags
Pennant patterns are either bullish or bearish and are considered to be continuous patterns. This pattern starts with a sharp upward or downward movement and enters a period of consolidation, which is characterized by a series of upward and downward movements. Subsequently, the price will break the pattern and continue with the previous trend. In a bullish pennant, the breakout is upward, signaling a continuation of the bullish trend, while in a bearish pennant, the breakout is downward, indicating a continuation of the bearish trend.

Conclusion
For crypto traders, mastering these chart patterns is crucial. They serve as a guide in navigating the volatile crypto market and making the right investment decisions. At CryptoTale, our market researchers and experienced writers decode the market mysteries. Our team delivers timely price analysis articles for readers to navigate the crypto market with ease. Follow us to know what’s happening in the crypto market.