Kava Price Prediction 2025-35: Will It Hit $50 by 2035?
- A falling wedge pattern on the chart hints at a bullish breakout for KAVA’s price action.
- Open interest in KAVA futures is rising fast, signalling anticipation of a major breakout.
- CryptoTale forecasts KAVA could rally to $8.00 in 2025, driven by post-halving hype.
Kava (KAVA) Overview
| Cryptocurrency | Kava |
| Ticker | KAVA |
| Current Price | $0.4067 |
| Price Change (30D) | -4.08% |
| Price Change (1Y) | -11.32% |
| Market Cap | $440.45 Million |
| Circulating Supply | 1.08 Billion |
| All-Time High | $9.19 |
| All-Time Low | $0.2483 |
| Total Supply | 1.08 Billion |
What is Kava (KAVA)?
Kava is a decentralized finance (DeFi) platform built to make borrowing and lending with crypto assets easy, accessible, and trustless. Whether you hold Bitcoin, XRP, ATOM, or other primary tokens, Kava allows you to unlock their value without selling them by using them as collateral to take out loans in a stablecoin called USDX.
How Does Kava Work?
Kava revolves around the concept of CDPs (Collateralized Debt Positions). Here’s a simple step-by-step breakdown:
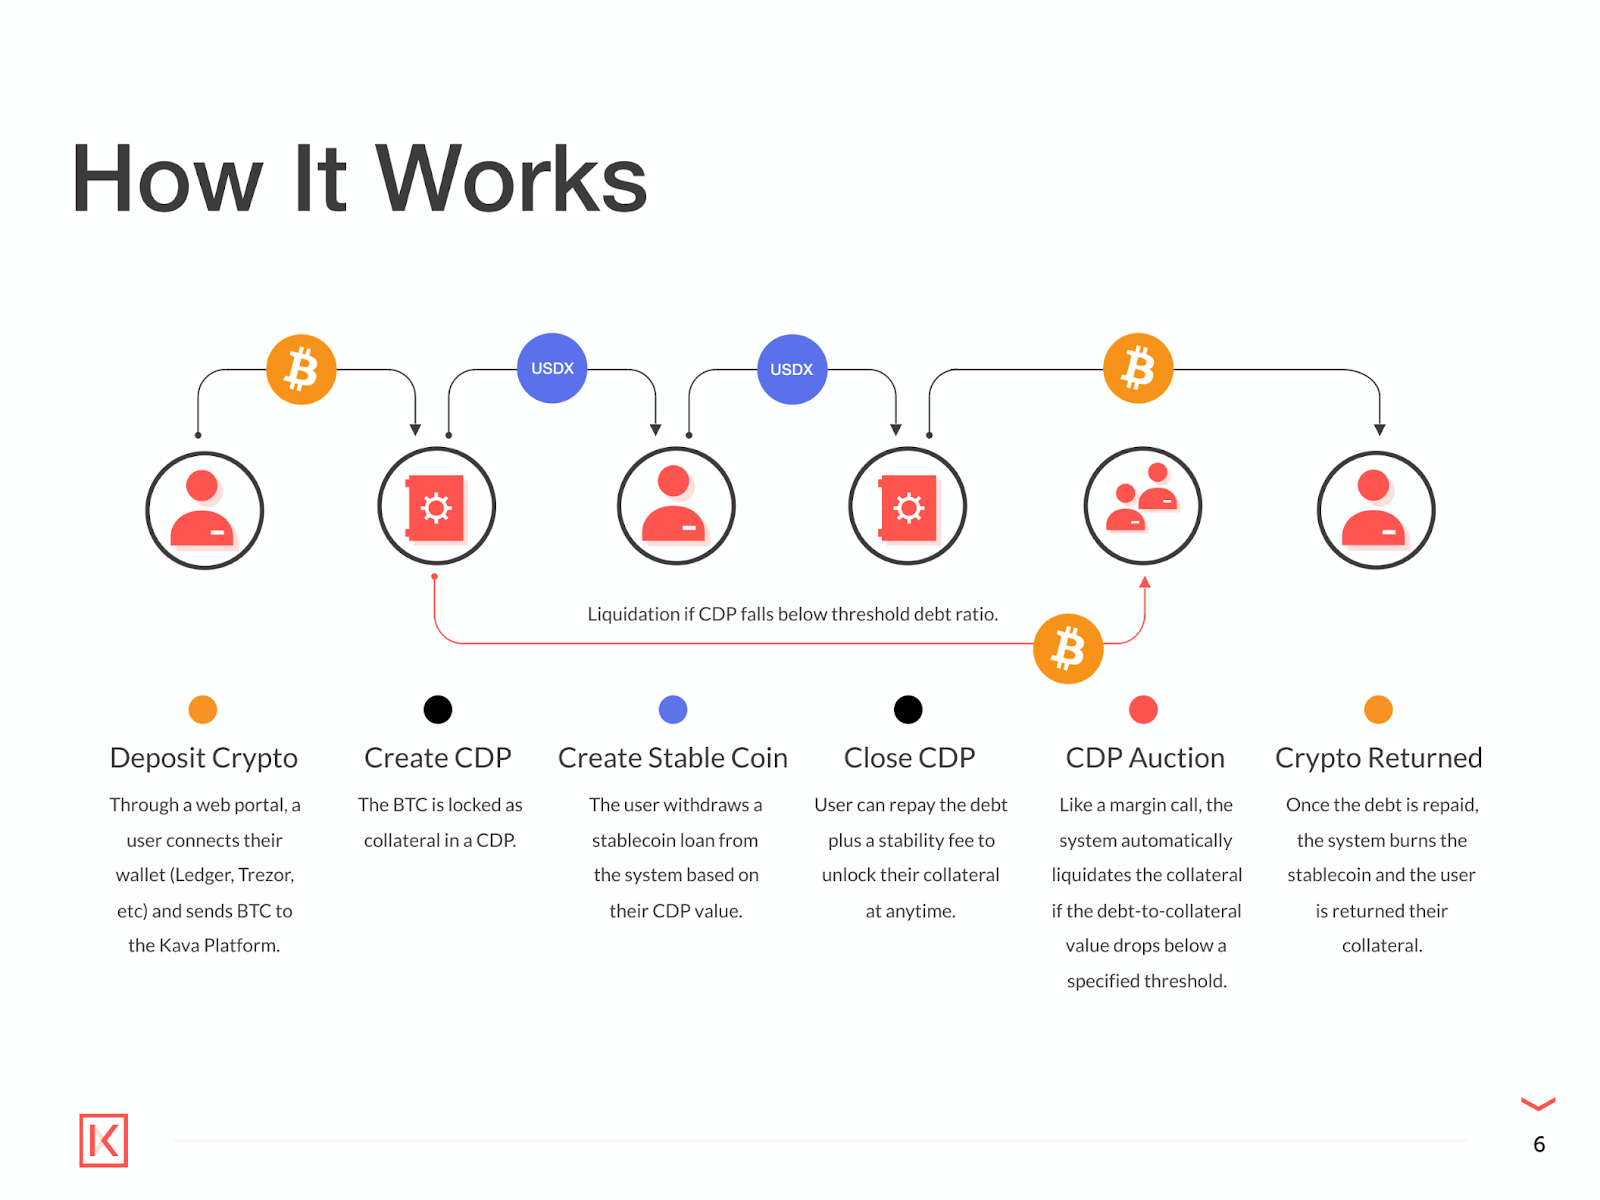
- Deposit Crypto: Users connect a wallet like Ledger or Trezor and deposit supported crypto (e.g., BTC or ATOM) onto the Kava platform.
- Create a CDP: The deposited crypto is locked in a smart contract as collateral.
- Mint USDX Stablecoin: Based on the value of the locked collateral, users generate a loan in USDX—a USD-pegged stablecoin.
- Repay and Unlock Collateral: Users can repay their debt (plus a small stability fee) at any time to unlock their crypto.
- Risk of Liquidation: If the collateral value drops below a required threshold, the CDP can be liquidated in an auction to protect the system.
- Return of Collateral: When debt is repaid, the system burns the corresponding USDX, and users regain full access to their crypto.
Why Kava Stands Out
- Multicollateral Support: Unlike many platforms that only accept ETH, Kava supports assets like BTC, XRP, and ATOM as collateral.
- No Intermediaries: Kava allows users to issue loans to themselves. There’s no bank, no credit score, and no counterparty risk.
- Built-in Stablecoin: Loans are issued in USDX, Kava’s stablecoin, which offers stability even during market volatility.
The KAVA Token: More Than Just a Coin
The KAVA token powers the entire ecosystem. Here’s how:
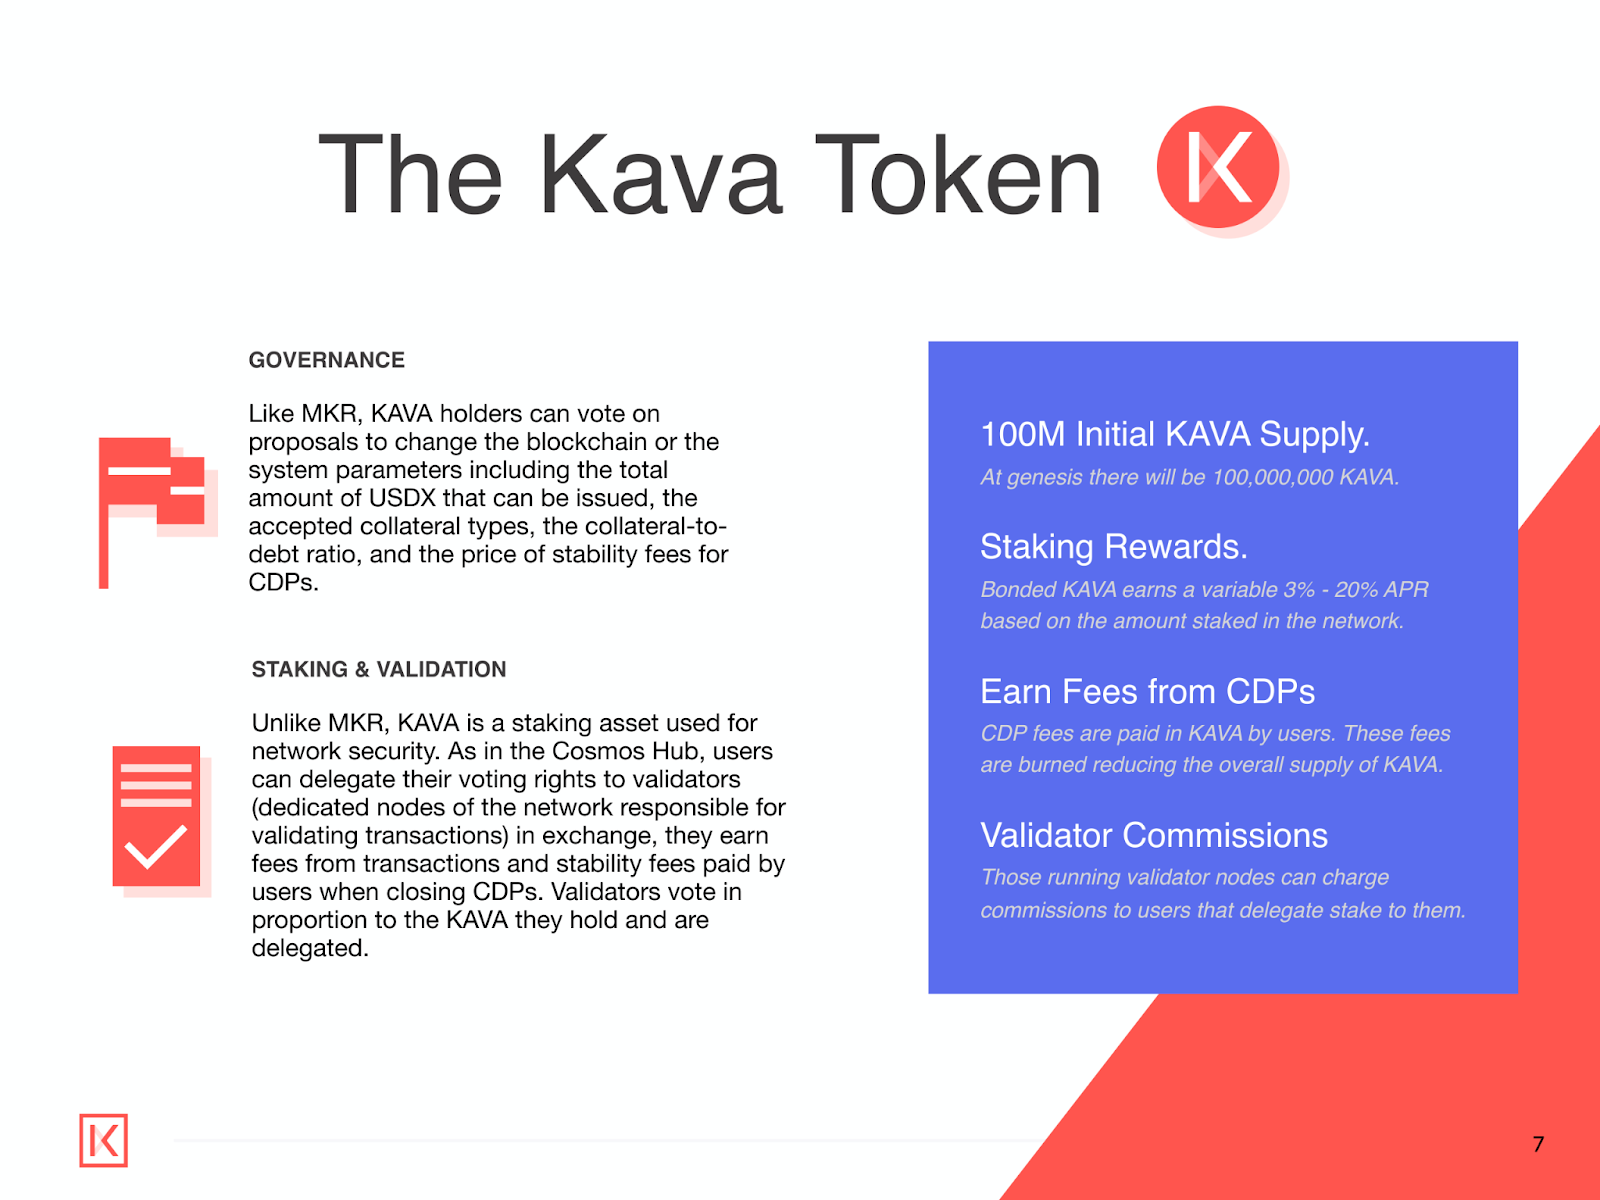
- Governance: KAVA holders can vote on critical system parameters like accepted collateral types, debt ratios, and issuance limits of USDX.
- Staking & Validation: Unlike governance-only tokens, KAVA is also a staking token. Users can stake KAVA to secure the network and earn rewards. Validators confirm transactions and receive both fees and commissions from delegators.
- Earn from CDPs: When users close CDPs, they pay fees in KAVA. These fees are burned, reducing the token’s supply over time and potentially increasing its value.
- Rewards & Supply: With an initial supply of approximately 100 million tokens, KAVA offers stakers rewards ranging from 3% to 20% APR, depending on how much is bonded.
Kava Price History
After launching in 2019, the KAVA token quickly surged to $1.63 before pulling back into a support range between $0.48 and $0.24. At the time, it may have seemed like a routine dip—but that support zone quietly laid the foundation for one of KAVA’s most powerful rallies yet.
From that base, the token soared over 3,600%, eventually peaking at an all-time high of $9.19. That peak, however, turned into a fortress of resistance. The price dropped sharply by over 70%, bottoming out around $2.56. This zone served as the launching pad for another rally, but it was weaker this time, topping out at $5.64.
That high, alongside the $4.66 zone, now forms a key resistance range that has kept KAVA under pressure since. Fast forward to August 2024, and KAVA found itself back at the historical $0.248 support, marking a new all-time low. Since then, it’s shown resilience, rebounding slightly and now hovering just around this familiar range.
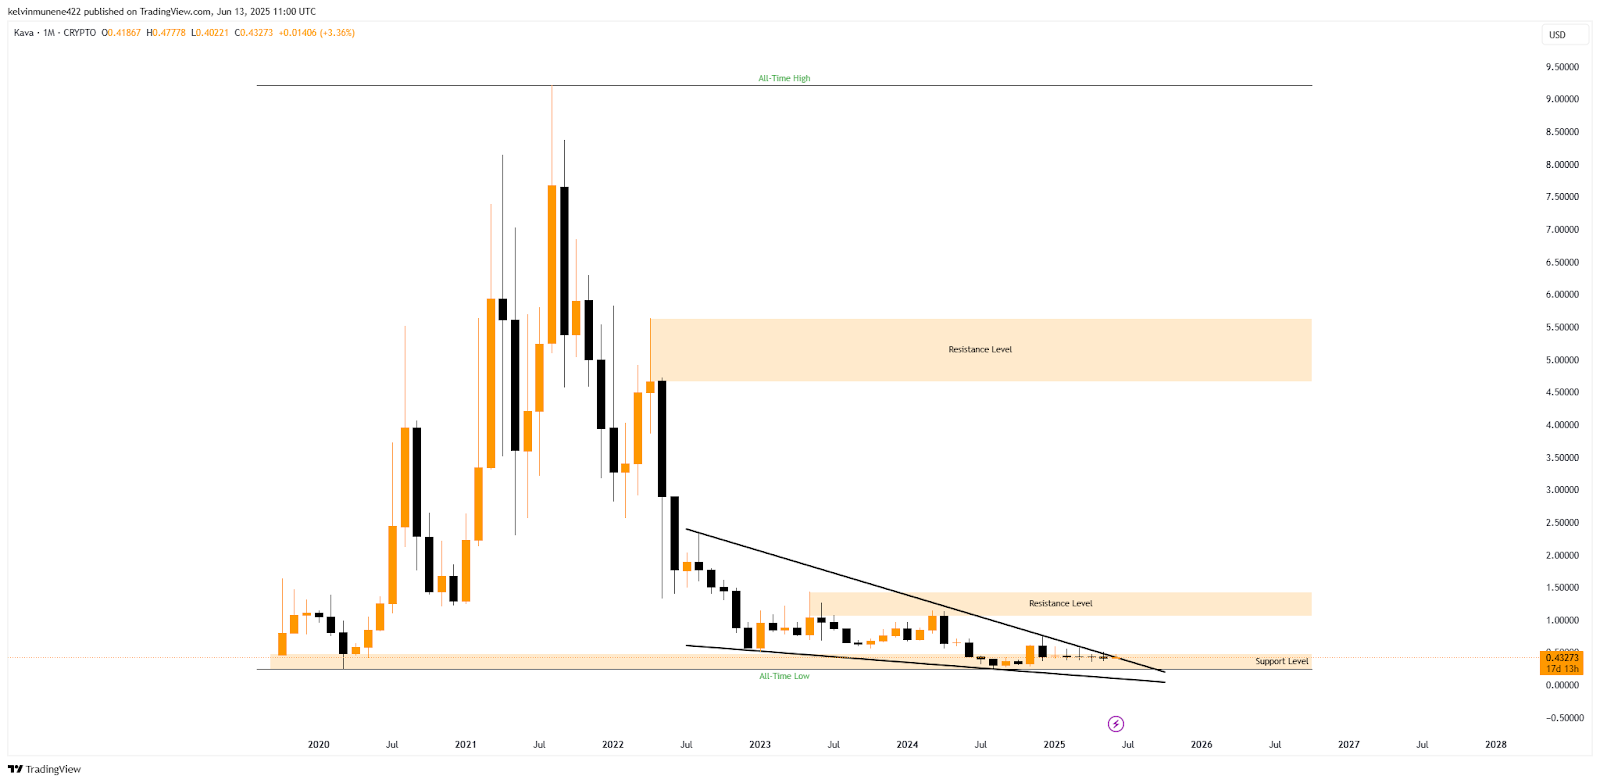
Technically, KAVA has been compressing into a falling wedge—a pattern typically associated with bullish breakouts. Besides, the token is now flirting with the wedge’s resistance trendline. A breakout here could propel KAVA toward its next resistance zone between $1.06 and $1.43.
If bullish momentum is strong, it might even retest the $5.64–$4.66 region—or, in the most optimistic case, aim for a new challenge at its $9.19 all-time high. However, failure to break above the wedge convincingly could spell trouble. Without a decisive push upward, KAVA risks sliding back to retest its all-time low—or worse, plunge into unexplored price territory.
On-Chain Activity Hints at Market Expectations
KAVA’s futures open interest has risen dramatically alongside price, climbing from under $20M to over $100M in recent months. This surge reflects growing trader engagement and speculation. Notably, open interest has continued rising even during price consolidation, suggesting that market participants are positioning for a major move.
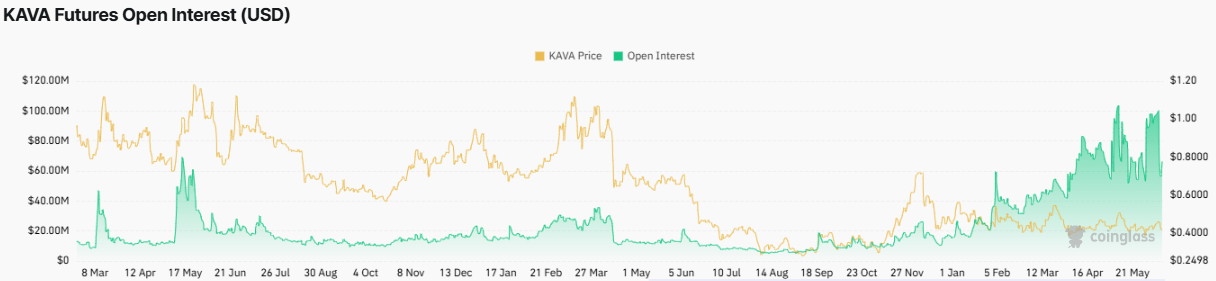
Whether these are long or short positions remains unclear, but the build-up of capital hints at mounting volatility ahead. This aligns with the technical breakout potential seen on the falling wedge chart, making the next few weeks critical for directional confirmation.
Related: Core Price Prediction 2025-35: Will It Hit $50 by 2035?
Yearly Highs and Lows of Kava
| Year | Kava Price | |
| High | Low | |
| 2024 | $1.14783 | $0.2483 |
| 2023 | $1.43831 | $0.51736 |
| 2022 | $5.82848 | $0.56728 |
| 2021 | $9.19 | $1.23792 |
| 2020 | $5.52156 | $0.2495 |
| 2019 | $1.63537 | $0.46294 |
Kava Technical Analysis
The MACD line currently reads -0.24702, trading above the signal line at -0.30173 signaling upward price momentum. Widening histogram bars reinforce this alignment, indicating a strengthening bullish sentiment behind KAVA’s recent price stabilization at around the $0.43 mark.
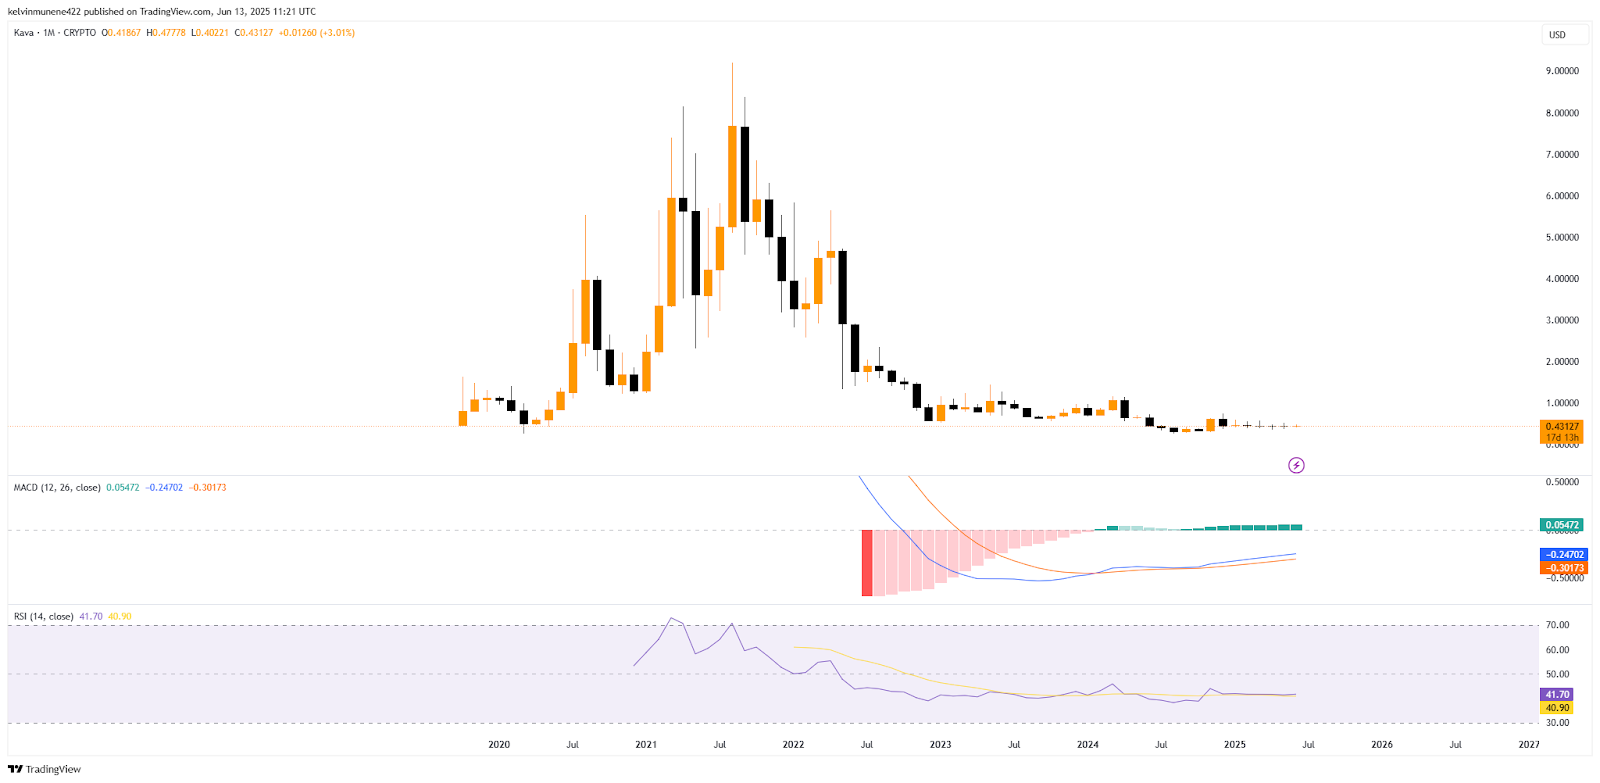
Historically, such MACD behaviour, especially after prolonged downtrends like the one seen from 2021 to late 2024, often signals the beginning of a potential trend reversal. This is further supported by the flattening RSI, which currently sits at 41.70. While still below the neutral 50 level, the RSI’s position suggests consolidation rather than exhaustion, with room to push higher if momentum builds.
Kava (KAVA) Price Forecast Based on Fair Value Gap
The Fair Value Gap (FVG) on the KAVA chart spans between $3.85 and $2.90, marking a significant resistance zone. This imbalance was created during the sharp price drop in mid-2022, when strong bearish momentum left an unfilled price void, an area where price action failed to develop efficiently.
Such gaps often attract future price revisits, acting as magnets when momentum builds. Currently, KAVA trades well below this FVG zone. However, should the token sustain its recent recovery attempts and break above lower resistance levels, this FVG could become the next key target.

The FVG’s width underscores its significance. A successful move into this range could signal deeper bullish intent, potentially unlocking further upside toward major resistance zones.
Kava (KAVA) Price Forecast Based on MA Ribbon Analysis
The 20-month moving average (MA) sits at $0.55, just above KAVA’s current price of $0.43, while the 50-month MA hovers higher at $1.77. This configuration places KAVA in a prolonged bearish structure, where the price continues to trade below both key moving averages.
Historically, this setup signals intense downward pressure, as these MAs act as dynamic resistance levels. Despite being below the 20 MA, KAVA has recently begun to flatten near long-term support, hinting at potential stabilization.
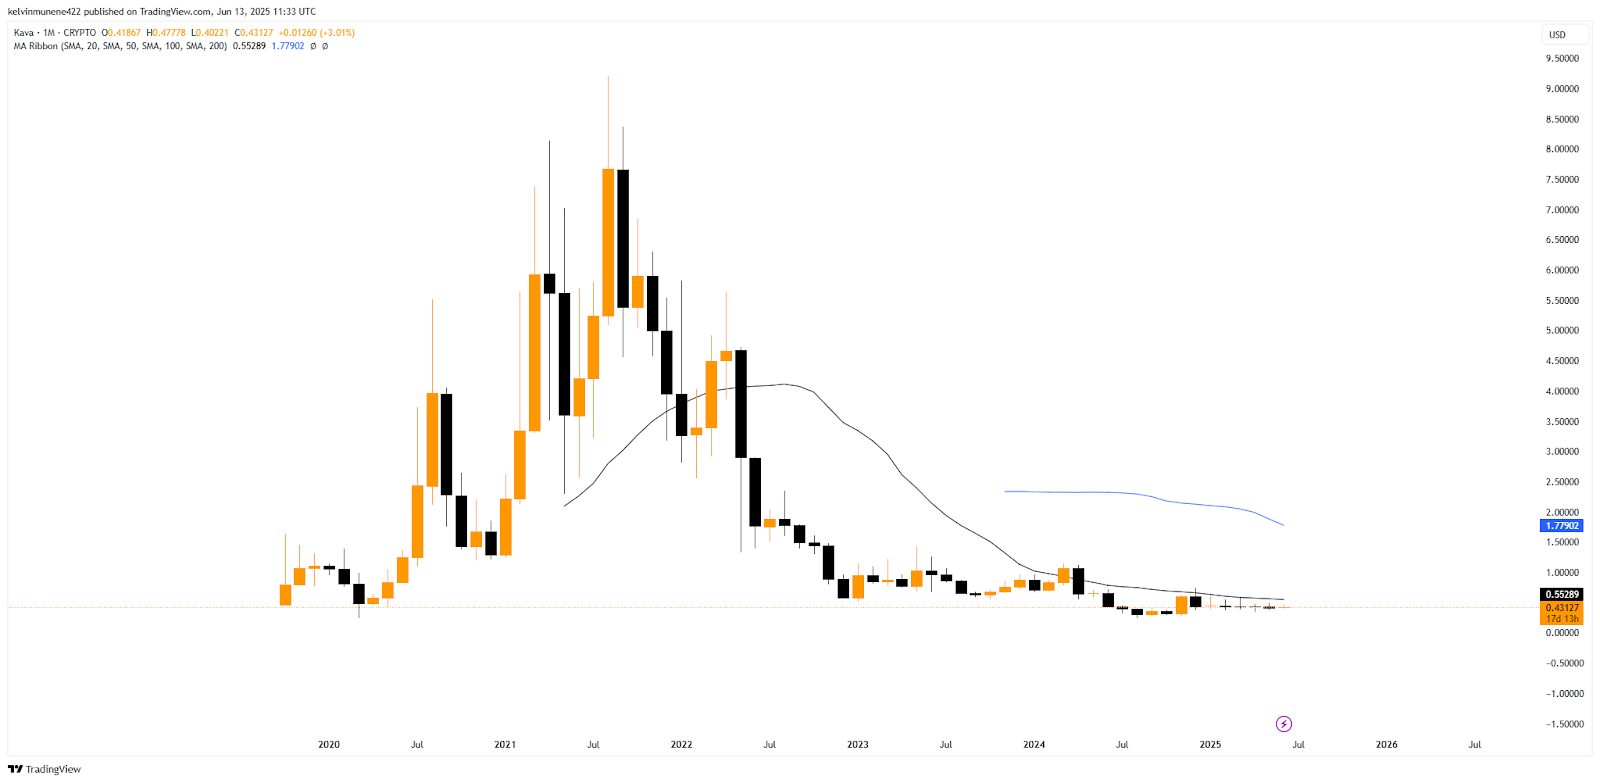
However, a decisive monthly close above the 20 MA could indicate the first technical step toward a trend shift. Yet, for a more robust confirmation of reversal strength, the price would need to break above 50 MA, which is currently over 300% higher than its current value.
This wide gap between the 20 and 50 MAs reflects the deep drawdown from KAVA’s all-time highs and the prolonged absence of bullish momentum. Any future bullish breakout would likely first face rejection or consolidation near the 20 MA zone.
Kava (KAVA) Price Forecast Based on Fib Analysis
KAVA is currently sitting well below the 23.6% Fibonacci retracement level at $2.36, which marks the first major barrier in any potential recovery. This level represents the shallowest pullback zone and often signals early resistance in a weak trend.
If KAVA manages to gain momentum, the next key Fibonacci level lies at 38.2% ($3.67), an area frequently aligned with minor reversals or consolidation. A stronger push could test the 50.0% mark at $4.72, the midpoint of the retracement and a psychologically significant level where bulls and bears often battle for control.

Beyond that lies the 61.8% retracement at $5.78, a level widely regarded as the “golden ratio” in Fibonacci analysis, known for producing strong reactions. Should KAVA reclaim that zone, the 78.6% level at $7.29 would be the final hurdle before a full retrace toward the all-time high at the 100% zone.
Given that the price is currently beneath even the lowest retracement level, the entire Fibonacci structure acts as a roadmap for potential resistance zones.
Kava (KAVA) Price Prediction 2025
According to CryptoTale’s projections, KAVA could surge between $0.24 and $8.00 in 2025, fueled by post-Bitcoin halving hype, a bullish wedge breakout, and rising on-chain participation. However, as the year progresses, the market may face a correction driven by overvaluation and profit-taking.
Kava (KAVA) Price Prediction 2026
Following peak cycle euphoria, KAVA may retreat to $1.50–$5.00, facing selling pressure, reduced demand, and broader market correction. Overvaluation from 2025 could trigger panic-driven exits as the market cools and enters a bearish consolidation phase.
Kava (KAVA) Price Prediction 2027
KAVA could find support between $1.00 and $4.50 during 2027’s market bottom. Recovery hopes and 2028’s halving anticipation may slowly rebuild investor confidence, setting the stage for a gradual uptrend after testing rock-bottom support zones.
Kava (KAVA) Price Prediction 2028
With sentiment improving, KAVA may recover to $7.50–$15.00. Network growth, active development, and the fifth halving hype could help conquer new highs, setting the groundwork for renewed bullish activity and investor engagement.
Kava (KAVA) Price Prediction 2029
KAVA could climb between $10.00 and $25.00, testing uncharted territories amid expanding adoption, growing dApp activity, and stronger market conditions. A sustained trend may position it for deeper moves into not-seen high-value zones.
Kava (KAVA) Price Prediction 2030
A moderate correction may bring KAVA down to $6.50–$18.00. Market-wide cooling and profit-taking may temporarily stall growth, though the price could still hold above critical technical zones.
Kava (KAVA) Price Prediction 2031
KAVA is projected to stabilize between $9.00 and $22.00, supported by stronger fundamentals, expanded utility, and renewed user trust. This phase likely fosters consistent reaccumulation as the ecosystem matures and prepares for the next cycle.
Kava (KAVA) Price Prediction 2032
Fueled by the 6th BTC halving, KAVA could rally to $15.00–$30.00. A resurgence in investor optimism, expanding co-chain support, and renewed institutional interest may drive bullish momentum across the crypto landscape.
Kava (KAVA) Price Prediction 2033
KAVA may reach $25.50–$45.00, driven by market expansion, high demand, and DeFi growth. FOMO from new and returning investors may push the price well beyond historical highs as optimism dominates sentiment.
Kava (KAVA) Price Prediction 2034
After explosive growth, KAVA may cool to $20.50–$40.00. While profit-taking softens momentum, ecosystem strength and adoption maintain relative stability. The correction may be healthy, but it is setting up for a stronger rebound in the next year.
Kava (KAVA) Price Prediction 2035
Anticipation of the 2036 BTC halving could drive KAVA to $35.50–$50.00, marking a new all-time high. Regulatory clarity, widespread adoption, and technological innovation may solidify its role as a leading DeFi asset.
Related: ZBCN Price Prediction 2025-35: Will It Hit $1 By 2035?
FAQs
KAVA is a decentralized DeFi platform that enables users to borrow, lend, and mint stablecoins using crypto assets like BTC, XRP, and ATOM as collateral.
You can buy KAVA on major exchanges like Binance, Coinbase, or Kraken using USDT, BTC, or fiat currencies via supported payment methods.
KAVA offers strong DeFi utility, but like all crypto, it carries risk. It’s ideal for long-term believers in cross-chain finance and decentralized lending.
Store KAVA in hardware wallets like Ledger or Trezor for maximum security, or use trusted software wallets with private key control.
Brian Kerr, Ruaridh O’Donnell, and Scott Stuart co-founded KAVA to build a cross-chain DeFi infrastructure on Cosmos.
KAVA officially launched in 2019 with the release of its mainnet and token distribution.
KAVA has a circulating supply of approximately 1.08 billion tokens, according to the latest data by CoinMarketCap.
Based on projections, KAVA may exceed its all-time high of $9.19 during future bull cycles, particularly by 2028–2035.
KAVA’s all-time low is $0.2483, recorded in August 2024 during a market-wide downturn.
In 2025, KAVA is projected to range between $0.24 and $8.00, driven by post-halving momentum and rising on-chain activity.
KAVA could trade between $7.50 and $15.00 in 2028 as sentiment strengthens and halving hype returns to the market.
KAVA may correct to between $6.50 and $18.00, reflecting natural cooling after the 2029 market expansion.
Fueled by the BTC halving, KAVA may rally between $15.00 and $30.00, supported by DeFi growth and co-chain adoption.
KAVA could reach $35.50 to $50.00 by 2035, driven by global adoption, innovation, and anticipation of the 2036 BTC halving.