BTC Tests $109K Support Amid Mixed Market Signals

- Bitcoin maintains its $109K after a fourth retest of a key support area this week.
- ETF inflows grow steadily as institutional demand returns, while retailers slow their buying.
- Glassnode data shows mixed signals as spot market bias stays weak near major resistance.
Bitcoin is once again walking a tightrope near the $110,000 mark, where buyers and sellers remain locked in a familiar tug of war. On-chain data from Glassnode and chart insights from Skew suggest that market sentiment is split between cautious optimism and quiet exhaustion.
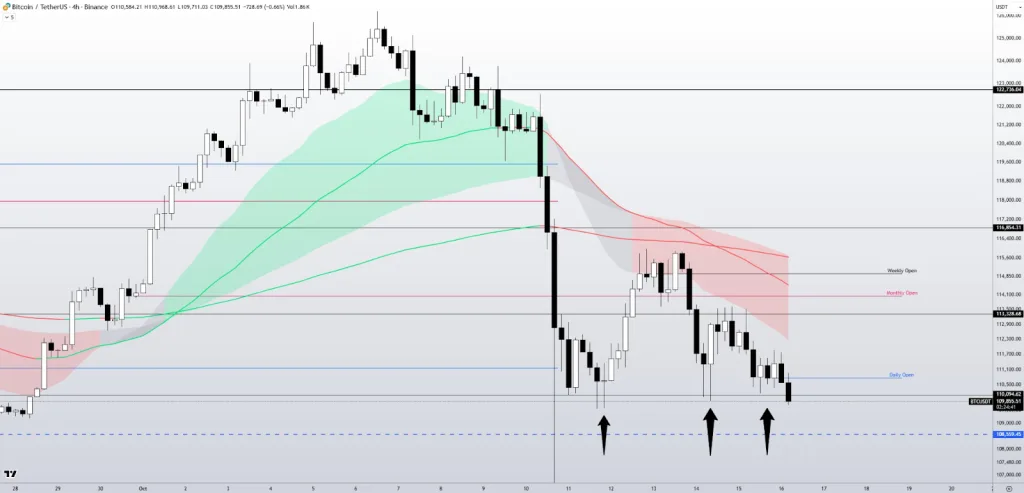
By Thursday, Bitcoin traded close to $109,855, marking the fourth straight attempt to hold the $109,600 demand zone. Analyst Skew, in a post on X, noted that the coin continues to bounce off the $108,559 level, a zone he described as a “psychological battleground.” In his words, “Time to lock in again,” as traders seem to be defending this area with more determination than enthusiasm.
Charts show that Bitcoin has slid sharply from $118,584, settling under a dense cluster of short-term moving averages shaded in red. Resistance levels have built near $114,900, the weekly open, and $114,100, the monthly open. Both the 50- and 200-period EMAs are trending near the $115,000 zone, capping any recovery and suggesting sellers continue to dictate the pace.
Institutional Demand Returns as ETF Flows Turn Green
Data from Glassnode indicates that U.S. spot Bitcoin ETFs are seeing renewed life. Through October, daily inflows have consistently exceeded 5,000 BTC, indicating a gradual resurgence in institutional confidence.
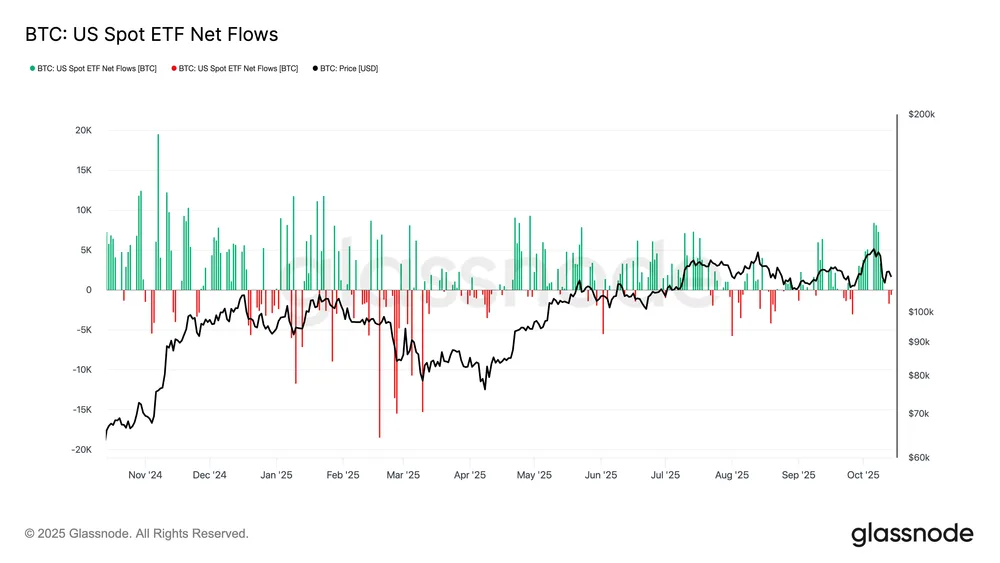
Earlier this year, February and March painted a different picture. Heavy outflows of above 15,000 BTC coincided with a sharp drop toward $75,000. Since that time, the green inflow bars have been arriving one after another, and the red ones have almost been removed. The steady deposits of between 2,000 and 10,000 BTC have supported Bitcoin’s ascent.
These inflows reflect the accumulation patterns of late 2024, when ETFs led to the buying streaks of several weeks. In contrast to the volatility of early 2025, the outflows have been shorter and weaker. This shift signals easing pressure from institutional sellers. A market strategist summed it up with a grin, saying that “Wall Street might finally be treating Bitcoin less like a meme and more like real money.”
Spot Market Data Shows Buyers Losing Nerve
At the same time, Glassnode’s cumulative volume delta bias (CVD) charts tell a more cautious story. On Coinbase, the bias sits near 300 BTC, while Binance trails slightly worse, near –500 BTC. Across exchanges, the overall figure is still mildly negative, around –400 BTC, suggesting traders remain hesitant.
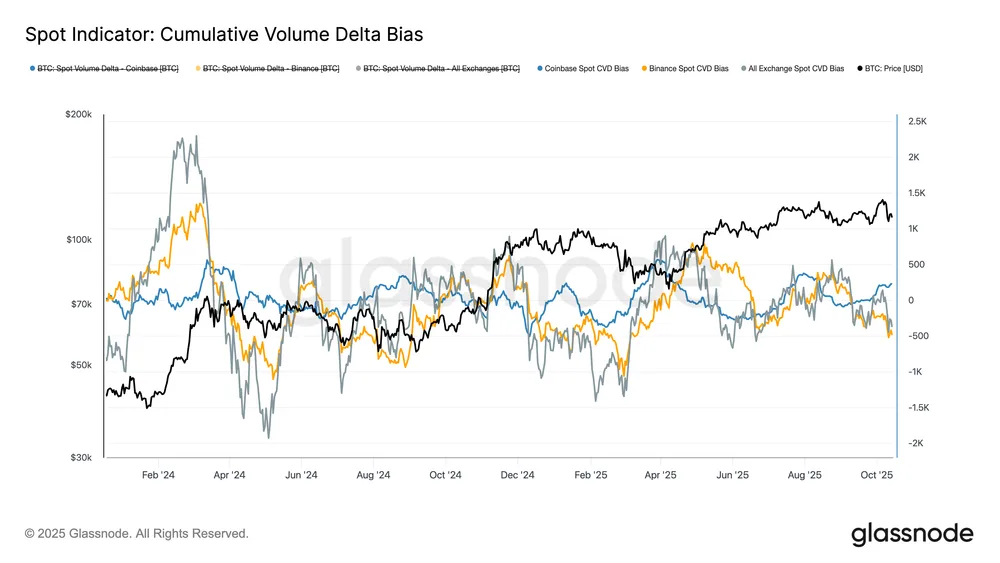
At the beginning of 2024, the scenario was much better. The CVD of Binance had increased to around 1500 BTC, thus becoming one of the main reasons behind the price rise from $45,000 to $100,000 as the U.S. buyers rushed in. However, by the middle of 2025, that alertness was gone. Binance and Coinbase went hand in hand, indicating that short-term players were taking a back seat. These readings have gradually gone down since August, showing that the main activity in the market is now profit-taking.
Even so, Bitcoin has managed to keep its footing above $100,000, holding steady despite lighter buying activity. Analysts now believe that if CVD numbers swing back into positive territory, another round of accumulation could take shape.
Related: Gold Rises as Bitcoin and U.S. Market Reach Record Highs
Caution Builds as Long-Term Holders Take Profit
According to Glassnode, Bitcoin’s next major move may depend on whether a new catalyst emerges to lift it beyond $117,100. The firm wrote, “Without a renewed catalyst to lift prices back above $117.1K, the market risks deeper contraction.” History shows that losing this level has often led to long correction phases.
Recent data also shows a rise in profit-taking among long-term holders, a sign of possible demand fatigue. Meanwhile, short-term traders appear reluctant to buy, waiting for clearer signals. Whether institutional inflows can counter that slowdown remains uncertain.Now, with Bitcoin’s fourth defense of the $109K zone unfolding, one question lingers across trading desks: could this level mark the start of a new leg upward, or the calm before another break lower?