Bitcoin Bounces Above $89K as Capitulation Pressure Climbs
- Bitcoin reclaimed $89K after tapping support at $80,685 with rising market tension.
- Capitulation surged to around 25T as selling pressure intensified across the market.
- Sharpe Ratio returned near 0 and signaled a rare setup seen before major shifts.
Bitcoin reclaimed the $89,000 level after a rebound from a support zone near $80,685. The move followed a precise touch of the falling wedge’s lower boundary, a pattern that shaped the entire decline since early November. The Bitcoin price surpassed the 23.6% Fibonacci level at $89,114, but the breakout was short-lived, with Bitcoin retreating to about $87,000 at press time.
The chart indicated significant resistance above this region. The 38.2% Fibonacci level sat at $94,328, while the 50% level stood at $98,542. Higher resistance zones stretched across $102,757 and $108,757. These levels rested inside a broader supply block that rejected price through September. The structure showed continued pressure as BTC stayed inside the wedge during the entire November decline.
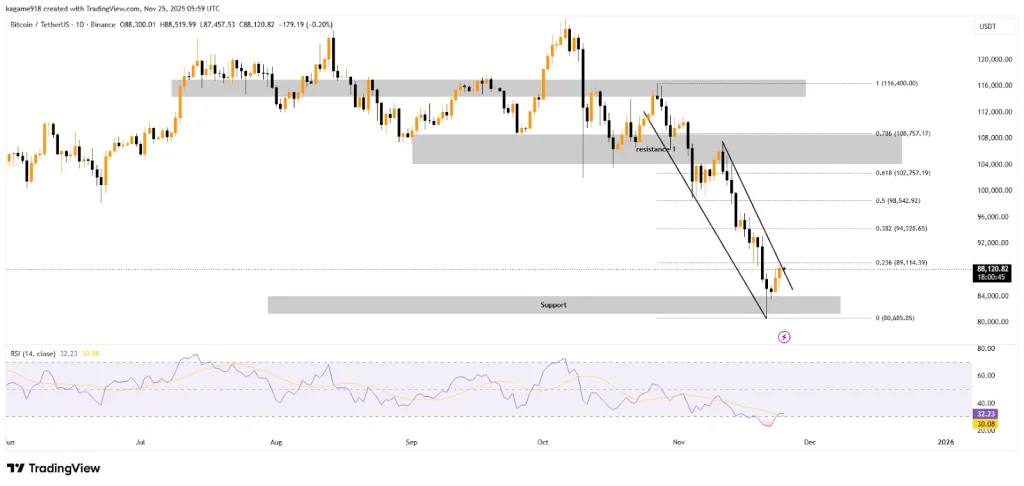
The daily RSI posted a reading of 32.23, placing it just above the oversold threshold. This signals that bearish momentum remains dominant but may be reaching exhaustion. If the RSI continues to hover near or below this zone, it could indicate that sellers are losing strength, increasing the probability of a short-term relief bounce.
Sharpe Ratio Signals a High-Risk, High-Reward Phase
The Bitcoin Sharpe Ratio returned to structurally depressed levels near zero. This shift aligns with conditions seen in 2019, 2020, and 2022. A CryptoQuant analyst, MorenoDV, stated that these periods often preceded multi-month trend formation.
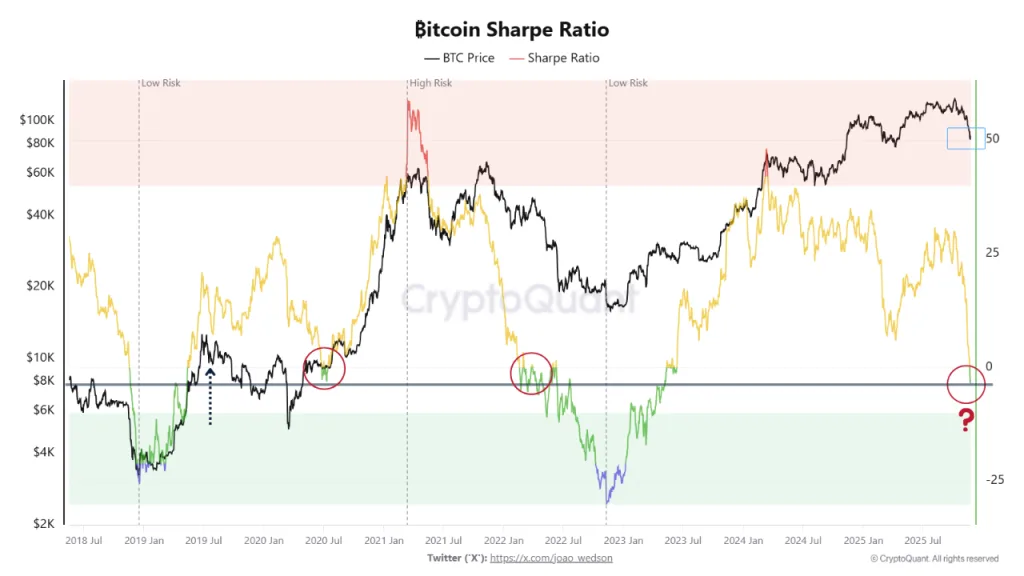
Investors watched this phase closely because these low-Sharpe conditions often offered better long-term risk-adjusted setups. The math behind these periods reflected improved potential future returns if volatility stabilized. Still, the market needed clearer directional signals before wider positioning could form.
The analyst noted that these phases did not guarantee bottoms. Yet the shift in risk-adjusted quality marked a point where investors evaluated structured entry strategies. The market remained sensitive to short-term fluctuations, so carefully sizing strategies remained essential.
Related: Bitcoin Cash Rallies by About 12% on Treasury Deal and Futures News
Capitulation Metric Surges to a Multi-Year Peak
Bitcoin entered a severe stress zone as the capitulation metric surged close to 25T. This move was the highest level since early 2020. Price also fell sharply from the 110k region toward the 90k area, and the chart displayed repeated capitulation spikes across 2024 and 2025.
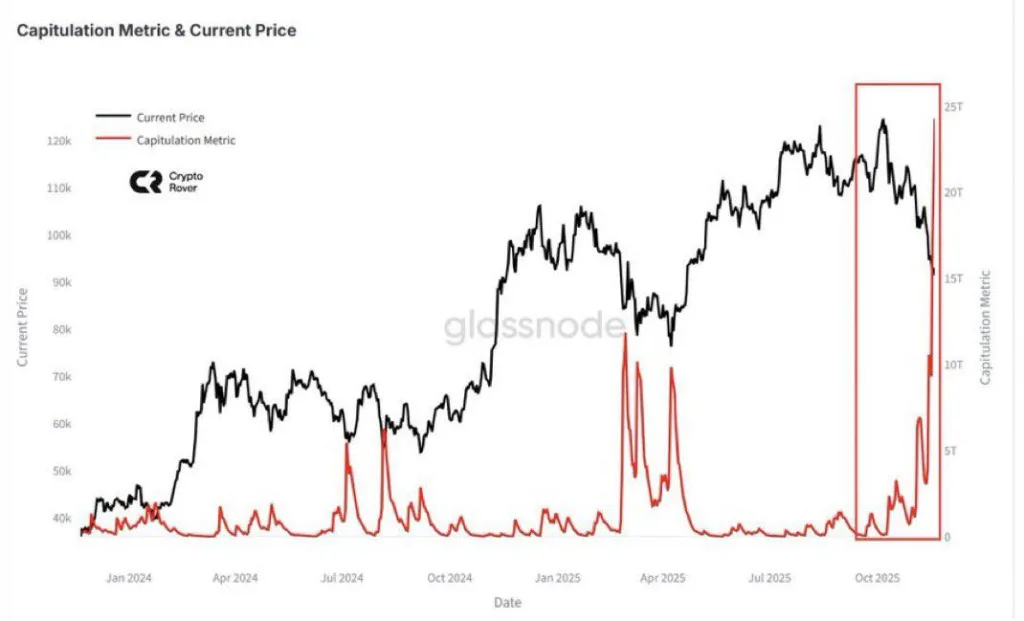
Analyst Rose said investor buying reached its lowest point, according to Glassnode data. Rose said the pattern matched conditions seen during the COVID crash and the FTX collapse. The red capitulation metric moved near zero before surging above 20T, which confirmed widespread loss-based selling.
Historical readings indicated that big red spikes frequently trail under market bottoms. The examples in July 2024, April 2025, and October 2025 were in correspondence with deep fear periods. These areas had high buyers who joined the market when weaker holders were forced out. The present value of around 25T brought about the key question that is circulating in the market: Can Bitcoin reclaim over $89K?