XRP Faces Deepest FUD Since October as Price Declines
- XRP enters its harshest fear phase since October after a 4 percent daily slide.
- Social data shows deep FUD as long liquidations rise and open interest weakens.
- Technical pressure grows as XRP trades below the 23.60 percent Fib retracement.
XRP’s market sentiment has slipped into its most severe negative zone since October, according to new analytics published by Santiment. The token has now dropped 31% over the past two months, with its latest 24-hour performance reflecting an additional 4% decline.
The data shows that social conversation surrounding XRP has shifted decisively toward fear, uncertainty, and doubt (FUD), creating the deepest concentration of negative commentary seen in months. Santiment’s sentiment-tracking model compares daily bullish and bearish commentary with XRP’s price performance.
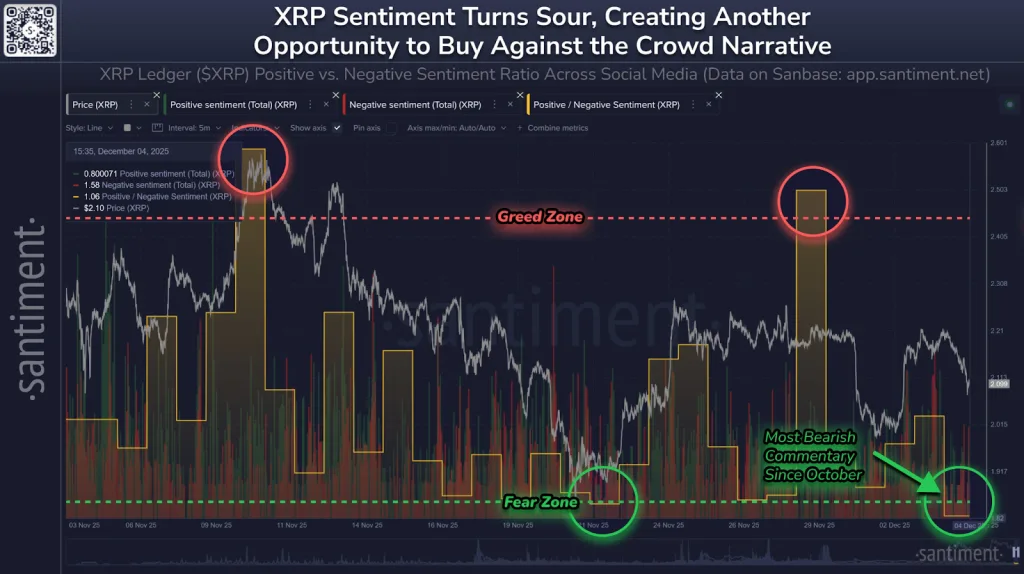
The chart highlights two behavioral zones: the Greed Zone, shown through red-circle spikes signaling days of abnormal optimism, and the Fear Zone, represented by green circles marking days when bearish commentary sharply exceeds bullish remarks. Historical readings suggest these emotional surges often precede short-term market reversals.
Fear Zone Returns at Levels Last Seen Before XRP’s 22% Surge
The latest chart places XRP deep inside the Fear Zone, shown through dense clusters of negative sentiment bars and a sharply reduced positive-to-negative ratio. Santiment notes that these readings closely match the sentiment collapse seen on November 21.
After that specific decline, XRP climbed 22% over three days before momentum cooled as crowd mood swung back into the Greed Zone. This earlier episode now serves as a point of comparison.
While the current figures offer no forecast of future moves, they show that the emotional structure of the market resembles the same configuration that preceded the late-November rebound. The firm adds that the market has again reached an extreme point where commentary leans heavily toward one direction.
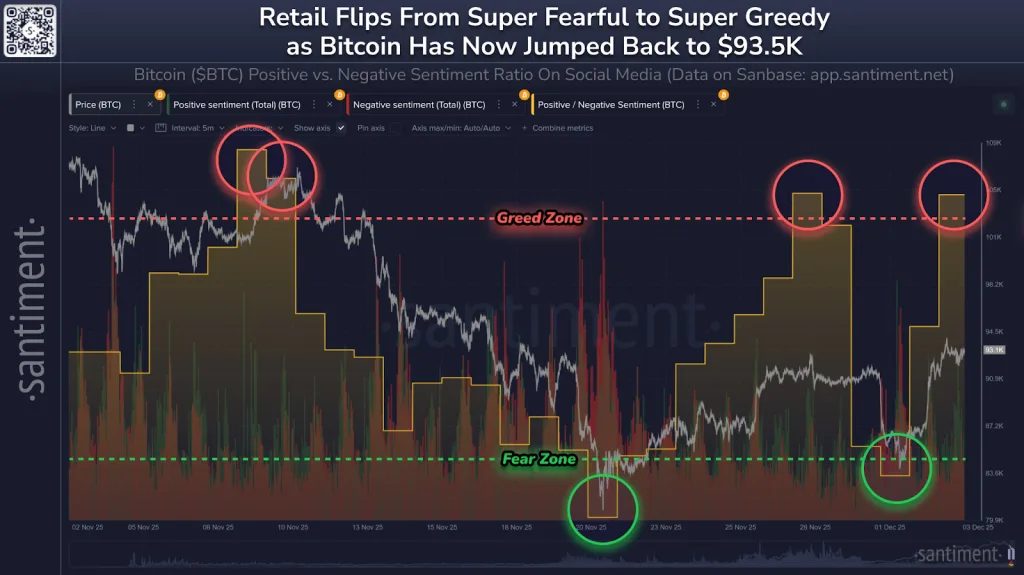
A striking contrast appears when comparing XRP with Bitcoin. During XRP’s slide into fear, Bitcoin has moved in the opposite direction with a rise in optimism. This split highlights how asset-specific narratives can run independently even when broader market conditions remain stable.
Price Holds a Two-Day Bearish Streak as Key Fibonacci Level Breaks
However, from a technical perspective, XRP’s price behavior reflects the downturn in sentiment. The token has now marked two straight sessions of losses and currently trades near $2.07 after sliding below the 23.60% Fibonacci retracement level.
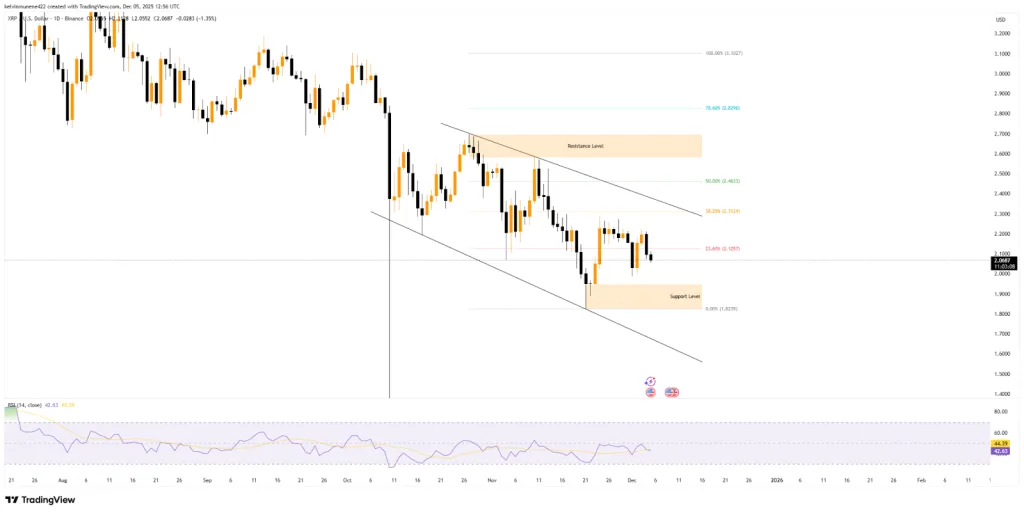
Its next visible range sits between $1.94 and $1.82, the same region that acted as support during the pullback recorded on November 21. Momentum adds further pressure. The Relative Strength Index has dropped below the neutral midline, showing that sellers currently hold control.
With the RSI trending downward, the chart leaves room for more declines before touching levels associated with oversold conditions. Liquidation data reinforces this pattern. Over the latest cycle, long positions absorbed $7.10 million in forced exits, compared with only $902.59k from short positions.
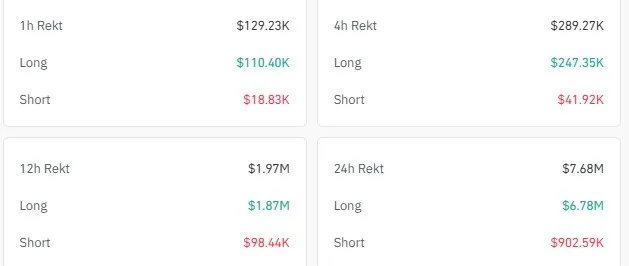
This imbalance points to a long squeeze, where traders on the buy side are pushed out of their positions at an increasing rate. Such conditions often thicken sell pressure as traders reduce exposure rather than add to it.
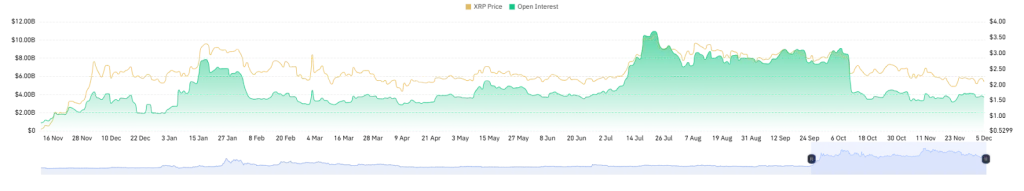
Open interest has also weakened. After nearly two months of moving sideways, the total has now fallen 3.75% over the past day to $3.71 billion, reflecting participants closing positions rather than maintaining or increasing them.
Related: BONK Stabilizes Around Key Support as Bonk.fun Updates Fee Model
Conclusion
The broader picture shows a market facing synchronized strain across several fronts: weakening sentiment, falling open interest, increasing liquidations, and the loss of a key technical level.
The similarity between the current Fear Zone reading and the November 21 profile provides only historical context and does not imply a directional outcome. However, if history were to repeat, XRP would reclaim the 50% Fib level at $2.46 before testing the resistance band between $2.69 and $2.58.
For now, the data illustrates a market shaped by crowd pessimism and sustained sell pressure, marking one of XRP’s most challenging sentiment stretches since October.