Ethereum Price Structure Firms Up as On-Chain Demand Grows

- Ethereum holds a daily triangle breakout as price stabilizes above former resistance levels
- Weekly structure rebounds from long-term support while the broader rising wedge remains intact
- Network data shows new addresses nearly doubling as on-chain activity hits record levels
Ethereum enters early 2026 with a quieter confidence than the headlines might suggest. The token’s price is no longer surging, yet it is no longer unraveling either. Instead, charts and network data point to a market that has shifted out of compression and into a more deliberate phase, where structure and usage are beginning to line up.
Recent sessions reflect that tone. A modest pullback followed a technical breakout, while on-chain figures show a sharp rise in new participants rather than recycled activity. Taken together, the signals describe a network regaining balance after months of uncertainty, with price stabilizing as underlying usage expands.
Daily Chart Shows Breakout Holding Its Ground
On the daily chart, the ETH price has resolved a symmetrical triangle that had been tightening since November. The formation reflected shrinking volatility and indecision, conditions that often precede a directional move. In ETH’s case, the upper boundary has now been cleared.
The breakout was later followed by a controlled pullback that retested the former resistance trendline, a behavior commonly viewed as technical confirmation rather than weakness. That retreat held above the 23.6% Fibonacci retracement near $3,171.9, turning what could have been a rejection into a controlled retest.
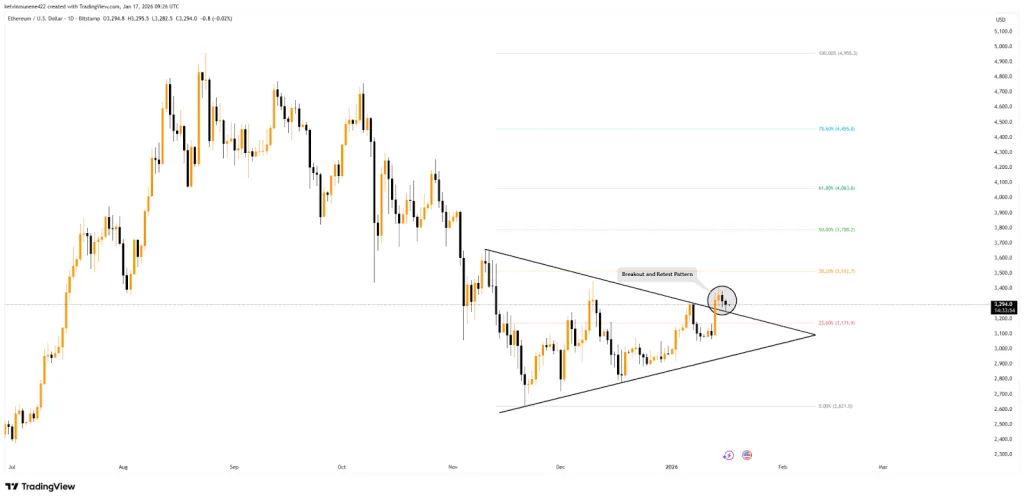
Source: TradingView
During the latest session, Ethereum traded close to $3,294, after marking an intraday high of $3,295.5 and a low of $3,282.5. The pullback was shallow, and the broader structure remained intact.
Price is also holding above the upper trendline of the former triangle range, a detail that suggests buyers are defending higher levels rather than waiting for deeper discounts. In technical terms, this behavior typically supports the validity of the breakout rather than challenging it.
Above current levels, Fibonacci retracements provide a clear map of overhead supply. The 38.2% level sits near $3,512.7, followed by $3,788.2 at the 50% mark and $4,063.6 at 61.8%. Higher up, the 78.6% retracement near $4,455.8 and the prior swing high around $4,955 remain longer-term reference points rather than immediate hurdles.
Weekly Structure Shows Bounce From Long-Term Support
The weekly chart tells a more cautious story. ETH’s price remains contained within a large rising wedge that has guided the market for years. This structure has repeatedly capped advances near the $4,900–$5,000 zone, an area reinforced by the 100% Fibonacci level at $4,955.
Recently, the altcoin’s price rebounded from the lower boundary of that wedge. The move coincided with support around the 38.2% retracement at $2,749 and a successful defense of the 200-week moving average near $2,464. Those levels have historically marked important inflection points during broader cycles.
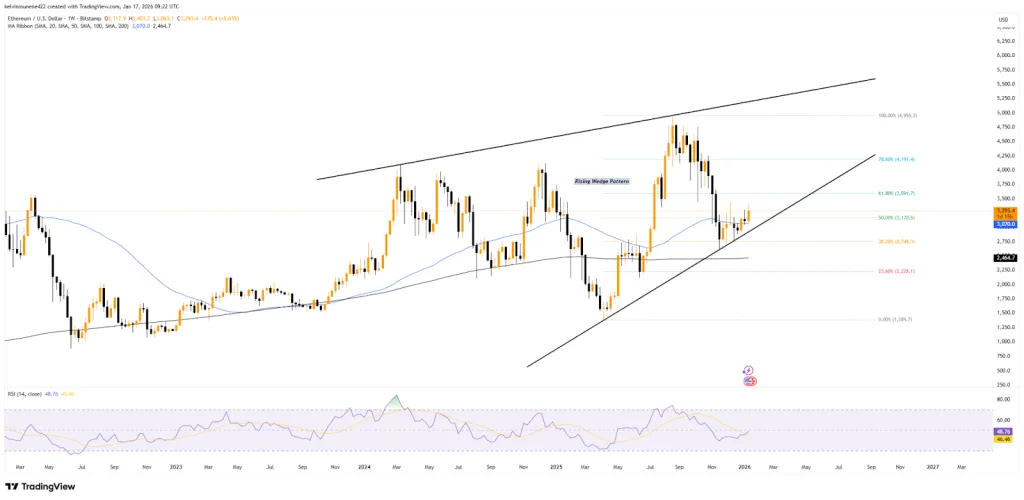
Source: TradingView
Similarly, momentum has improved on shorter horizons. Ethereum’s price has reclaimed the 50-week moving average around $3,070 and is stabilizing above the 50% Fibonacci level at $3,170. Moreover, the weekly RSI has recovered toward the midline, reflecting improving balance without the stretched conditions seen near major peaks.
Related: TRON Holds Long-Term Ascending Channel as Weekly Trend Stays Firm
Network Metrics Point to Fresh Demand
Away from the charts, network data shows a clear shift in participation. According to figures shared by Glassnode, month-over-month activity retention surged in the “New” cohort, which tracks addresses interacting with the network for the first time.
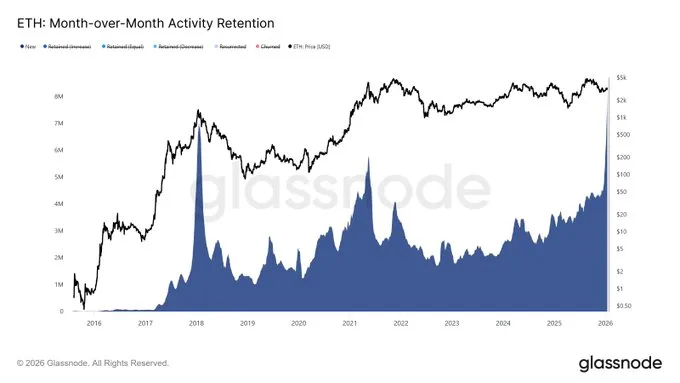
Source: Glassnode
New addresses rose from roughly 4 million to about 8 million over the past 30 days, nearly doubling in a single month. That jump stands out against a steadier base of returning users, suggesting recent growth is being driven by fresh entrants rather than repeated activity from the same wallets.
Longer-term metrics reinforce the trend. Daily active addresses have climbed from around 410,000 a year ago to more than 1 million in mid-January. At the same time, daily transaction counts reached a record 2.8 million, up about 125% year over year.
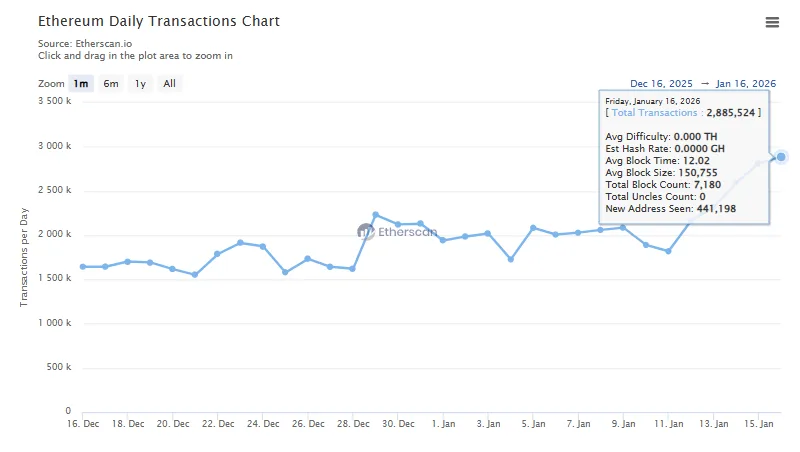
Source: Etherscan
Glassnode has noted that activity retention helps separate durable growth from brief spikes. The current profile points to users not only arriving but also beginning to stay active, adding weight to the view that network usage is broadening as 2026 gets underway.