BTC Hashrate Slides 15% as Ongoing Miner Capitulation Pulls Price to $89K

- BTC hashrate fell 15% from October highs as miner shutdowns and reserve sales grew faster.
- Repeated difficulty cuts and miner sales for AI funding kept the BTC price under pressure now.
- Over $403M in BTC liquidations tracked a break below $90K as leverage unwound and volume surged.
Bitcoin’s mining sector is showing fresh signs of strain as the network’s hashrate slips well below its October peak, adding another layer of pressure to a market already dealing with accelerated selling. The drop, roughly 15% from the highs, reflects a steady retreat by miners who have been running at thinner margins for weeks.
As a result, many have begun switching off older machines, and the effect is now visible in network data. Average hashrate has fallen from about 1.1 zettahashes per second in October to a recent low near 934 exahashes per second.
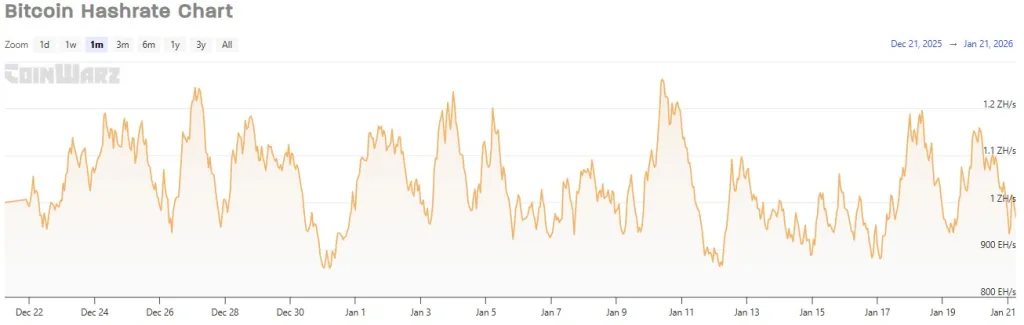
Source: CoinWarz
However, it has modestly inched back toward 1.006 zettahashes per second in the past day, but that bounce has not changed the underlying picture. The broader mining ecosystem remains in a defensive posture, and the decline has landed at a moment when BTC has slipped into the $89K region.
Miner Capitulation Signals Network Stress
One of the more closely followed gauges, the Hash Ribbon, flipped on Nov. 30, just after BTC bottomed near $90K. Traders often treat that shift as evidence that miners are drawing down reserves to stay operational.
It also suggests that supply hitting the market is temporarily elevated, though not necessarily for long. Asset manager VanEck noted that extended periods of miner capitulation have historically preceded phases of stronger price momentum.
As inefficient operators exit, selling pressure tends to ease once the 30-day moving average of hashrate climbs back above the 60-day average. Current readings suggest the market may be approaching that inflection point, though stress has not fully cleared.
Difficulty Drops as Machines Go Dark
The steady hashrate retreat has produced another string of negative difficulty adjustments. According to reports, the next update, expected on Jan. 22, is projected to trim difficulty by about 4% to roughly 139 trillion.
If confirmed, it would be the seventh reduction in eight cycles, not a common run, and a clear marker of how wide the pullback has become. Some miners are also diverting attention toward more capital-intensive business lines, including AI and high-performance computing.
Firms such as Riot Platforms have continued selling portions of their BTC holdings to finance these pivots, adding more supply during an already strained stretch for the market.
Liquidations Add Speed to the Decline
From an on-chain point of view, BTC’s slide from last week’s high near $97,900 to below $90,000 unfolded quickly as leverage unwound. At last check, BTC traded near $89,465, down about 2.35% over the past day.
On-chain figures show more than $403 million wiped out in liquidations, with roughly $377 million tied to long positions that were washed out as the price slipped through key levels. Besides, trading volume nearly hit 100% gain as forced selling picked up pace.
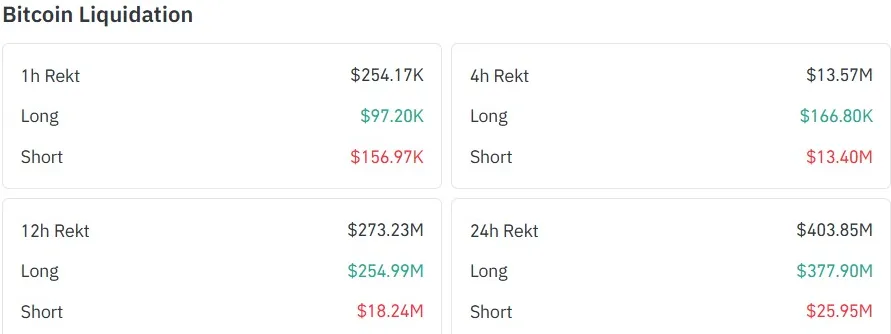
Source: CoinGlass
Sentiment deteriorated just as fast. The Crypto Fear & Greed Index dropped from 42 to 24 within a day, pushing the gauge into “extreme fear.” Social feeds echoed the move, with bearish commentary gaining traction as the market weakened.
Related: Zcash Price Drops 8% as Bearish Signals Firm Across the Chart
Technical Picture Holds a Narrow Path
Even with the heavy mood, BTC found support along an ascending triangle trendline that it has repeatedly tested over the past two months. The recent rebound that followed offers a small measure of stability, though conviction remains thin.
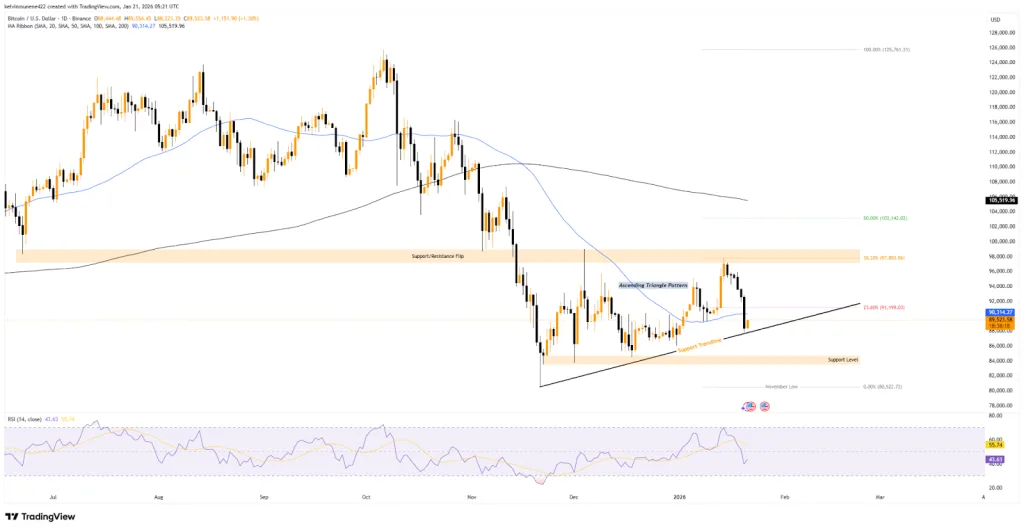
Source: TradingView
The 50-day moving average near $90K, closely aligned with the 23.6% Fibonacci level, is now the barrier to watch. A clean break would open the door toward the $97K region, a former support zone now acting as resistance.
However, failure to hold the lower boundary of that triangle would expose the $84.7K to $83.5K area, with November’s $80.5K low still lurking beneath. Meanwhile, the RSI, sitting near 43, reflects sellers still guiding the tape, though its recent upward tilt hints at a tentative shift. Whether that builds into something stronger will likely define BTC’s next move.