
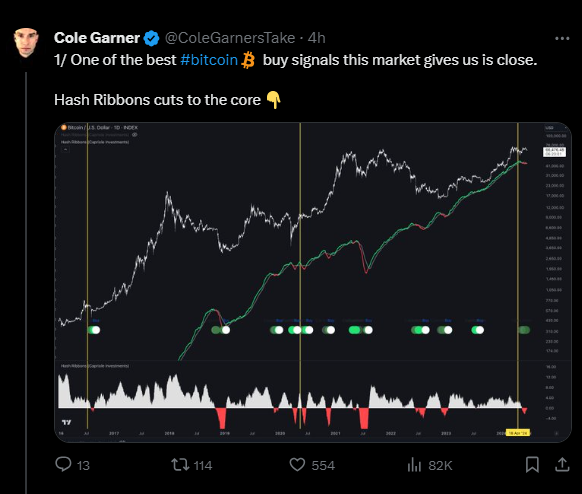
As the Bitcoin market teeters on the edge of a significant buy signal, Cole Garner, an analyst, is closely watching the Hash Ribbons indicator. This metric, introduced by caprioleio, has proven to be a reliable predictor of market movements, especially after Bitcoin halvings.
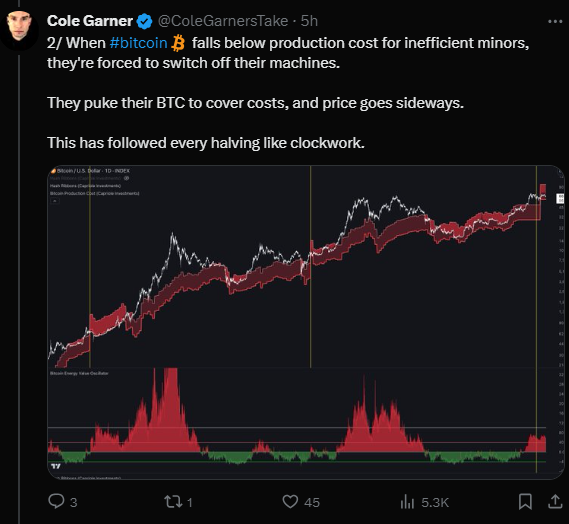
As further noted by Cole Garner, when Bitcoin’s price drops below production costs, inefficient miners often shut down their machines. To cover their expenses, they sell their BTC holdings, causing the price to stabilize. This pattern has been consistent following every Bitcoin halving, including the ones in 2016 and 2020, where the price went sideways for approximately 160 days each time.
However, this does not necessarily mean that Bitcoin will experience a stagnant summer. As the hashrate starts to recover, the Hash Ribbons will signal a potential buying opportunity. Historically, this has been one of the most dependable indicators for Bitcoin purchases. Currently, the market is on the cusp of receiving this signal, which has garnered respect and attention from the cryptocurrency community.
Charles Hoskinson Explains Why Cardano’s Flexibility Will Eclipse BitcoinExamining the current market conditions, Bitcoin is trading at $65,554, reflecting a slight dip of 0.70% over the past 24 hours. Despite this minor decline, the trading volume has surged by 102.54%, reaching $36.24 billion. This high trading activity indicates increased market participation. Additionally, Bitcoin’s market capitalization stands at $1.37 trillion, down by 0.70% in the last 24 hours.
The circulating supply of Bitcoin is 19.71 million BTC, which accounts for 93.88% of the total supply. The maximum supply of Bitcoin is capped at 21 million BTC. The 1-day Relative Strength Index (RSI) for Bitcoin reads 61.75, suggesting a neutral market state. This neutrality implies potential for both upward and downward price movements in the near future.
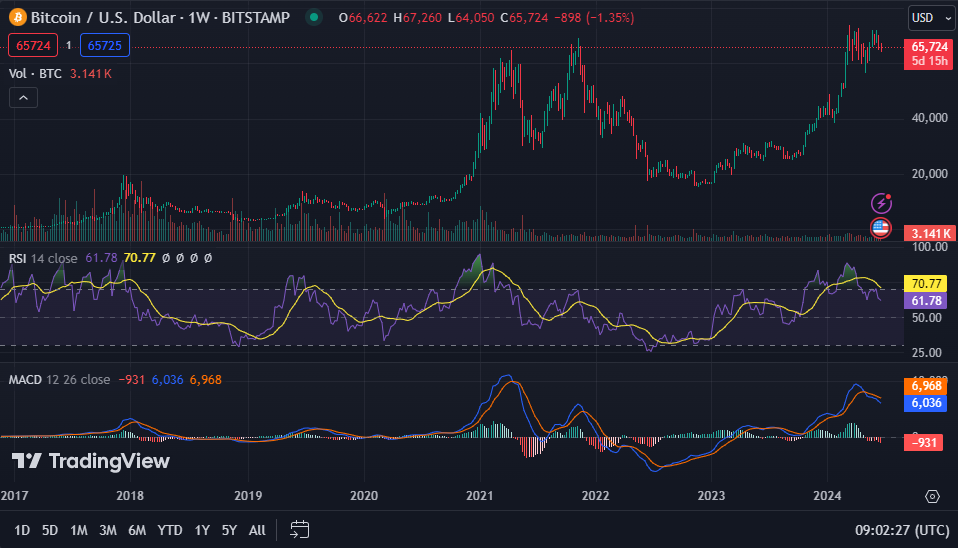
On the technical analysis front, the 1-day Moving Average Convergence Divergence (MACD) is trading below the signal line. This position indicates a possible bearish trend in the short term.