
Three cryptocurrencies have caught the attention of analysts due to their potential for significant upward movement. Celestia (TIA), Arbitrum (ARB), and Fantom (FTM) are all showing promising signs, prompting detailed technical analyses from various experts.
Captain Faibik highlights the potential for a breakout in Celestia (TIA). The chart indicates a descending channel, suggesting a bearish trend with consistent lower highs and lower lows. Recently, TIA experienced a bullish movement, rising from the channel’s lower boundary to its upper boundary, suggesting strong upward momentum.
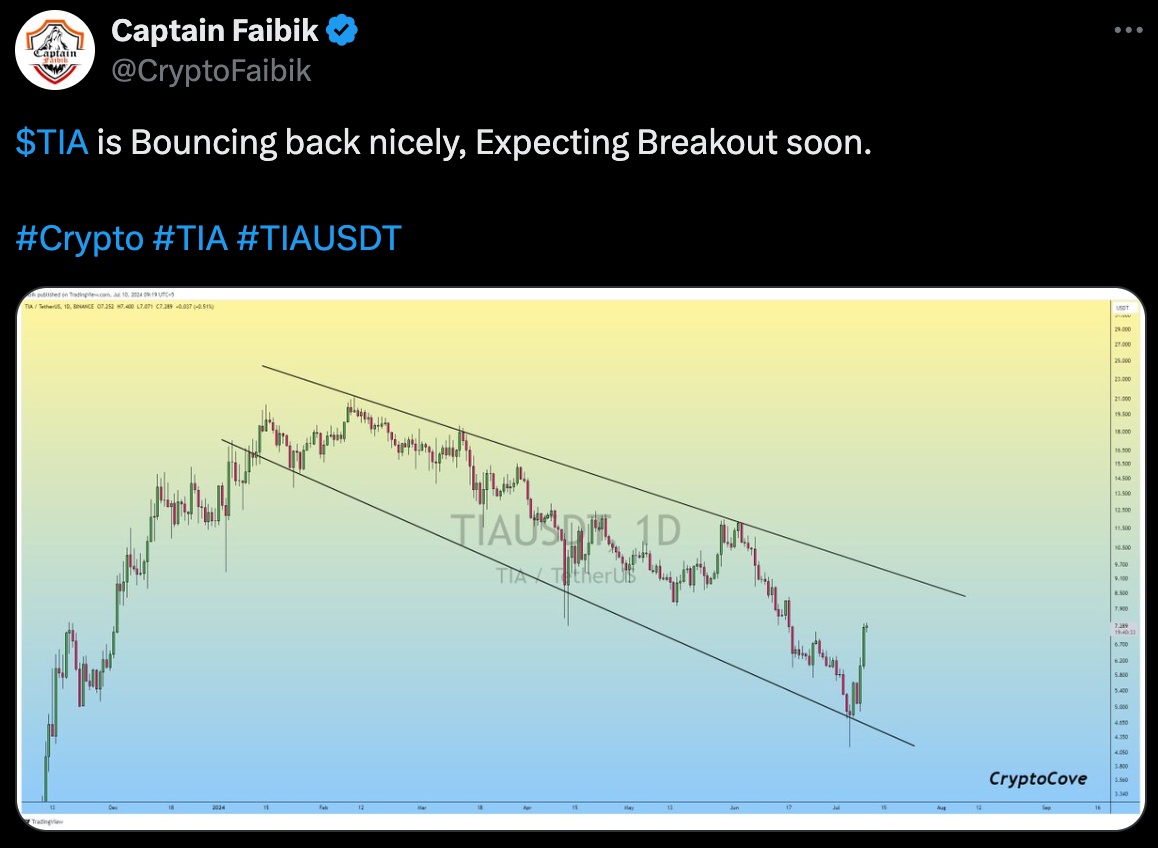
As of press time, the price of TIA is at $6.80, with a 24-hour trading volume of $314,375,145. This marks a 5.87% increase in the last 24 hours and an 18.44% rise over the past seven days. With a circulating supply of 200 million TIA, its market cap stands at $1,335,504,801. If TIA breaks above the descending channel’s upper boundary, it could signal the end of the bearish trend and the start of a new bullish phase. However, failure to break this resistance could see TIA testing the lower boundary once again.
Nehal’s analysis of Arbitrum (ARB) points to a possible reversal after a prolonged downtrend. The price has consistently made lower highs and lower lows, but a bottoming pattern suggests a potential change. The volume profile indicates significant activity around the current price, highlighting strong support at $0.6775 and resistance at $0.8518 and $1.25.
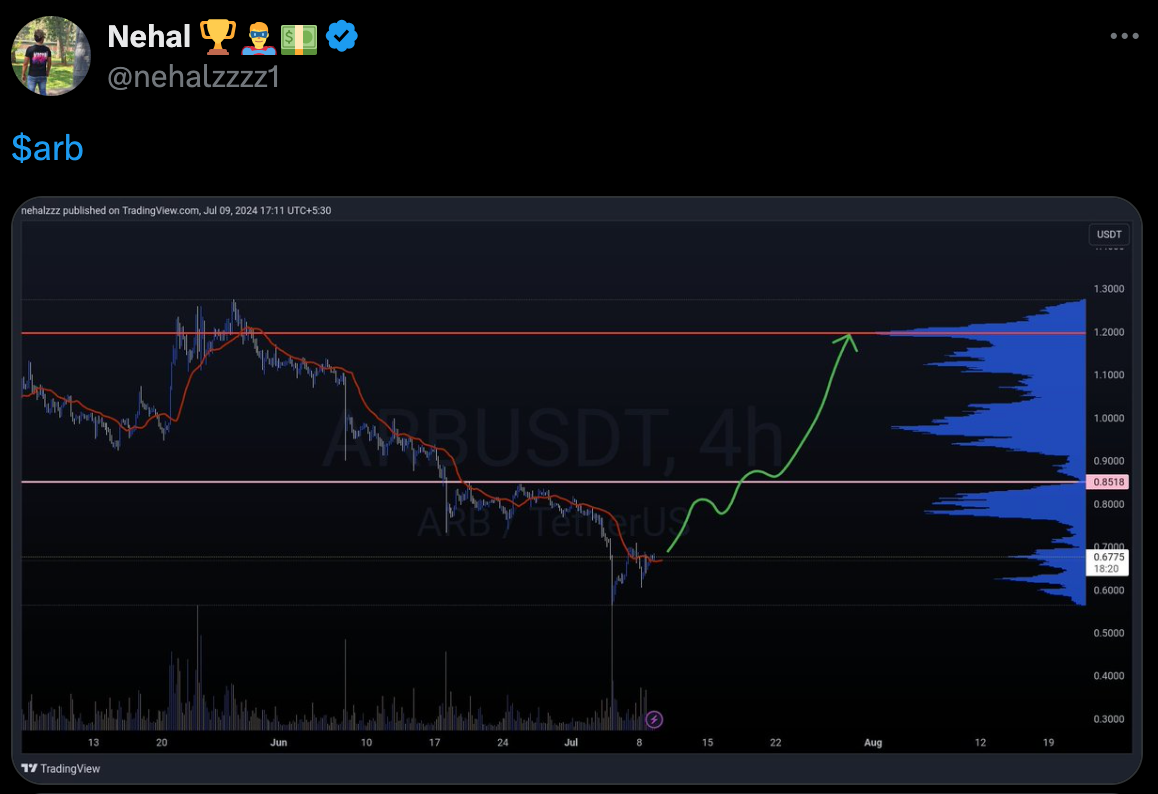
ARB is priced at $0.7072, with a 24-hour trading volume of $286,564,540. This represents a 4.56% increase in the last 24 hours, though the past week saw an 8.36% decline. With a circulating supply of 3.2 billion ARB, the market cap is $2,283,670,003. If ARB holds above the $0.6775 support and breaks the $0.8518 resistance, the next target could be $1.25. However, falling below the support could continue the downtrend.
Chainlink Experiences Largest Trader Capitulation of 2024, Signaling Possible Market BottomWorld Of Charts focuses on Fantom (FTM), noting that a correction might have completed and a bullish wave could be forming. The chart displays a falling wedge, typically a bullish pattern. The price of FTM is at $0.4712, with a 24-hour trading volume of $217,797,567. The price marks a 6.83% increase in the last 24 hours despite a 14.72% decline over the past week.
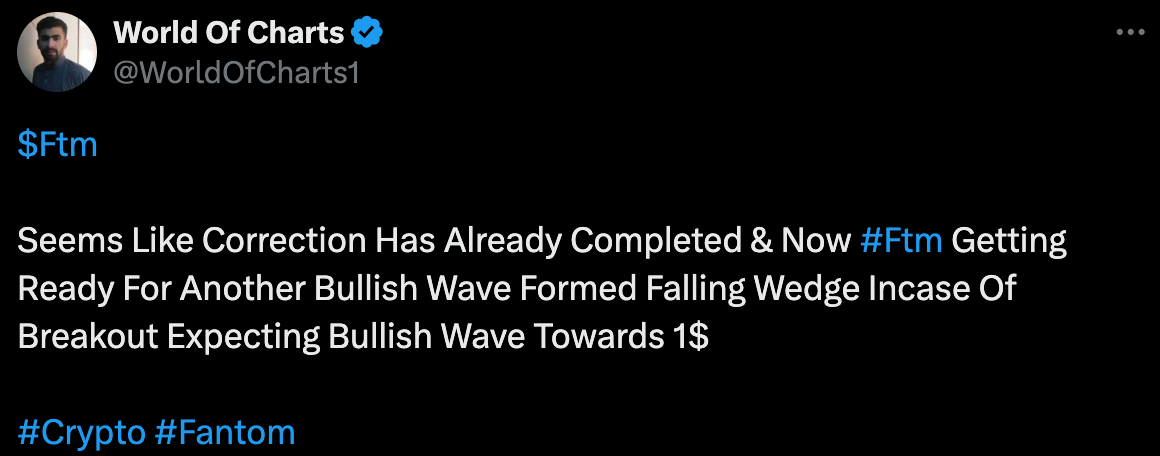
With a circulating supply of 2.8 billion FTM, its market cap is $1,320,344,744. A breakout from the falling wedge could lead FTM towards $1.00. Notably, the pattern’s completion indicates a significant bullish potential. However, failing to break out could see the continuation of the downward trend.