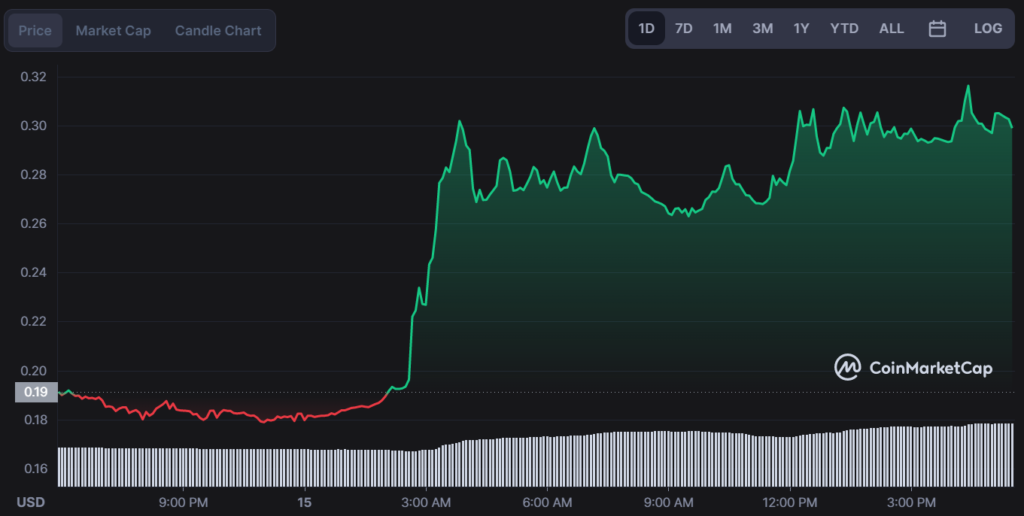
Serum price analysis indicates the altcoin has been declining since it reached an all-time high of $13.73 in Sept. 2021. The recent market dip saw the digital asset dip to a new low of $0.12 following the FTX bankruptcy as it was one of the biggest listings on the FTX balance sheet, with $2.2 billion in SRM. The serum is trading at $0.3048 at press time, up 56.67% on the day.

The bullish correction is attributed to technical analysis of the coin’s latest price movements which reveals a breakout pattern on the daily chart with resistance points at $0.2858 and $0.3310, while support points are at $0.1937 and $0.1694.
Serum’s recent bull run may lead to a sell-off as the cryptocurrency has been racing against the wind for a couple of weeks, but with impressive bullish momentum, we may see Serum prices breaching resistance points and possibly testing new highs.
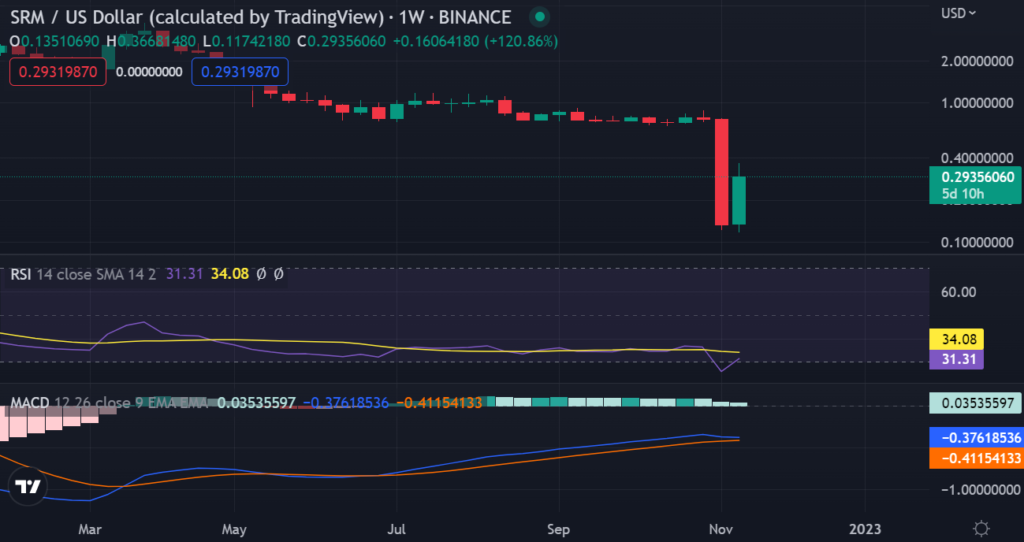
Weakly RSI Points Long-Term Bearishness
A bearish divergence pattern has formed on the weekly Relative Strength Index chart which suggests that the price may soon correct lower. A bearish outlook seems likely in the short term, but a strong support level at $0.2858 and further down to $0.1937 may cushion any potential losses for Serum holders.

Serum Technical Analysis
Serum price analysis on a daily chart shows the cryptocurrency is in a bullish engulfing pattern with support points at $0.2858 and $0.3310, and resistance points at $0.3645 and $0.4180. A breakout may be imminent as the momentum is pointing north.
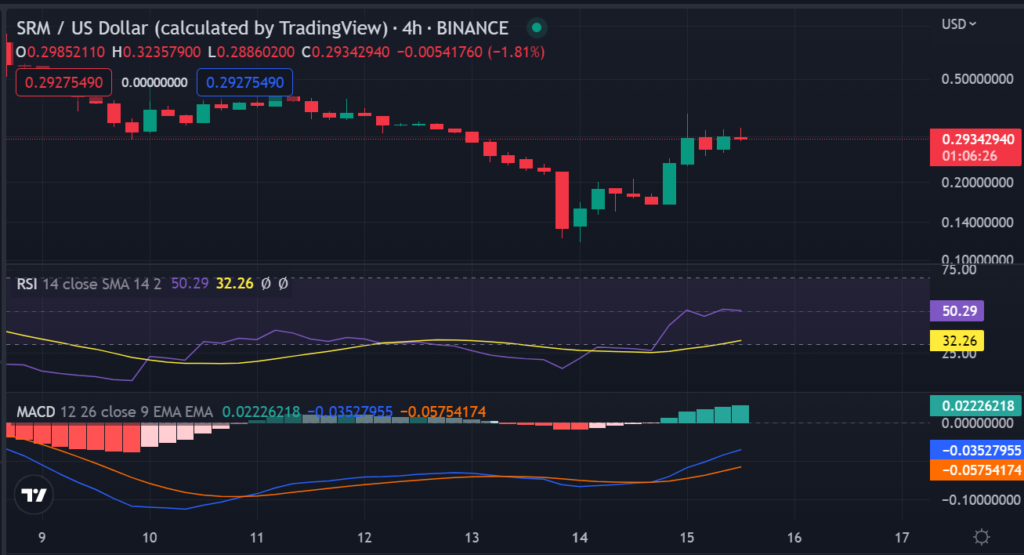
On the 4-hour chart, serum prices may be headed for a bearish correction as the price has breached its 100-day MA and is currently trading below it. The MACD indicator shows decreasing bullish momentum, while an ascending channel pattern formed with support at $0.3310 and resistance at $0.3645 suggests a possible breakout in the coming days.

The serum has been enjoying a strong price surge over the past few hours, with prices climbing up to $0.3048 at press time. Technical analysis suggests that this bullish momentum may continue in the near future, with possible breakouts and higher resistance points ahead. However, there are some concerns of a potential bearish correction as well due to the MACD indicator and an ascending channel pattern on the 4-hour chart.


