
Chainlink ($LINK) is currently exhibiting a textbook falling wedge pattern on its weekly chart, a formation that often signals a potential bullish reversal in price trends. The pattern was spotted by Dom, an analyst. This pattern emerges amidst a broader context of market consolidation following a significant downtrend.
In order to confirm the next major price direction traders and investors alike are closely monitoring this setup. High-timeframe (HTF) signals from leading cryptocurrencies like Bitcoin (BTC) and Ethereum (ETH) are crucial to know.
Bitcoin Trends Upward: Will It Break the $100K Barrier?Key technical levels underscore the current dynamics of Chainlink’s price action. At approximately $11.738, the cryptocurrency has found robust support, repeatedly validated by multiple tests.
Conversely, the immediate hurdle lies at $14.355, where a breakout would signify a bullish confirmation and potentially pave the way for further upward momentum. For more ambitious targets breaking above the $35.82 resistance zone is seen as crucial.
The falling wedge pattern itself is characterized by converging trend lines, with the price forming lower highs and lower lows over time. A breakout above the upper trend line of this wedge can be considered a definitive signal of a bullish reversal. It might trigger a rally towards higher resistance levels.
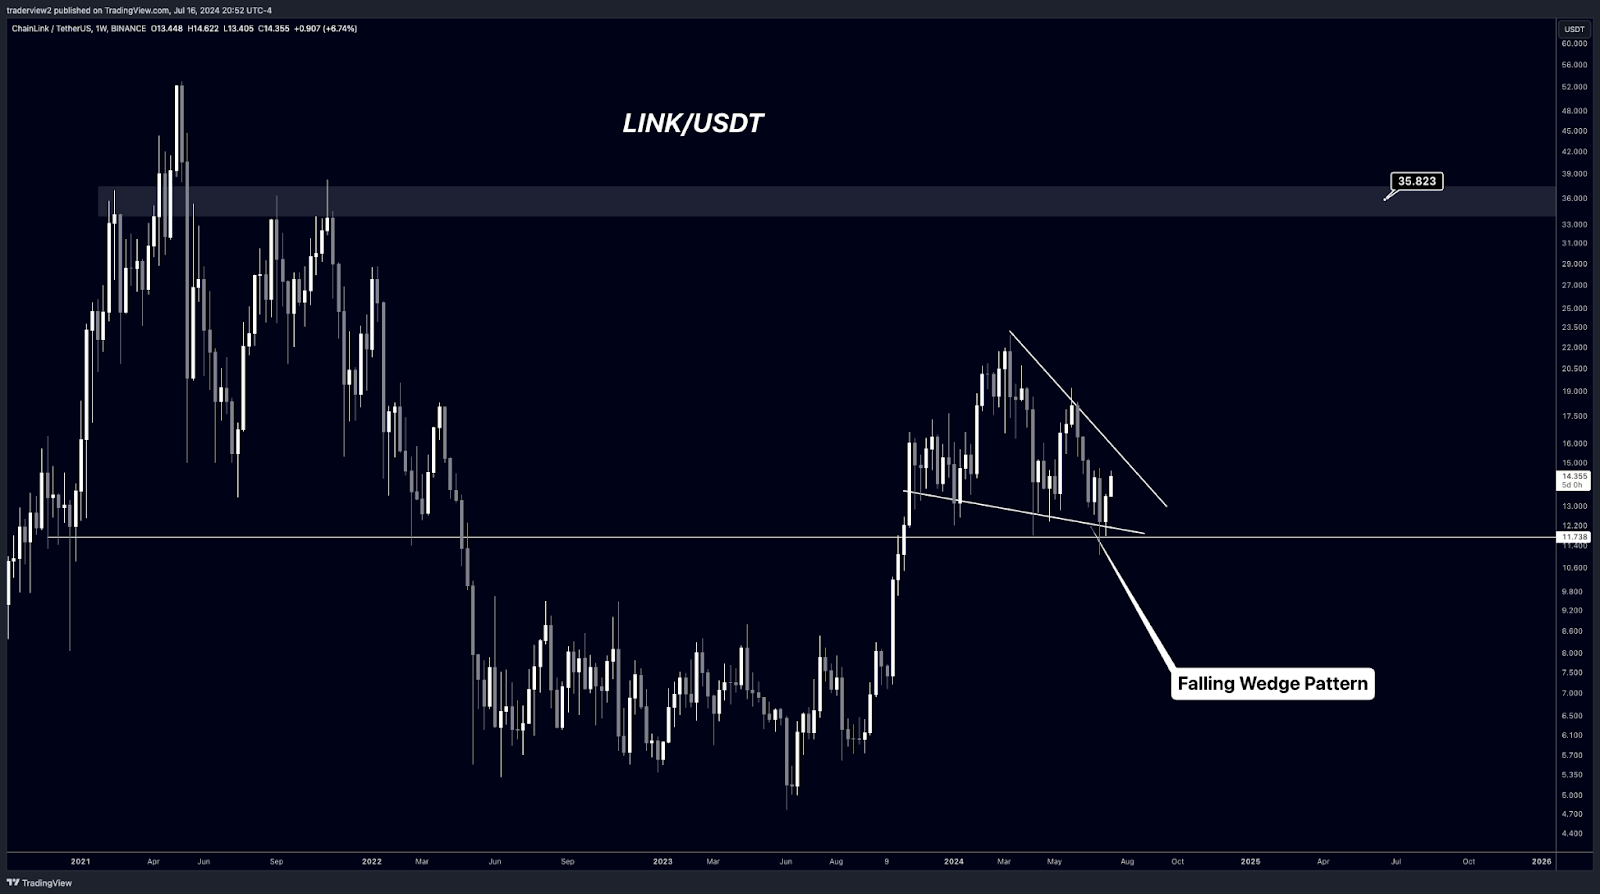
Considering potential scenarios, a bullish outlook hinges on Chainlink surpassing the $14.35 resistance level. There is also a possibility for it to breach the upper trend line of the falling wedge.
Such developments could lead to sustained upward movement, targeting higher resistances such as $35.82. Conversely, failure to break above immediate resistance and a drop below $11.73 support could indicate further downside pressure.
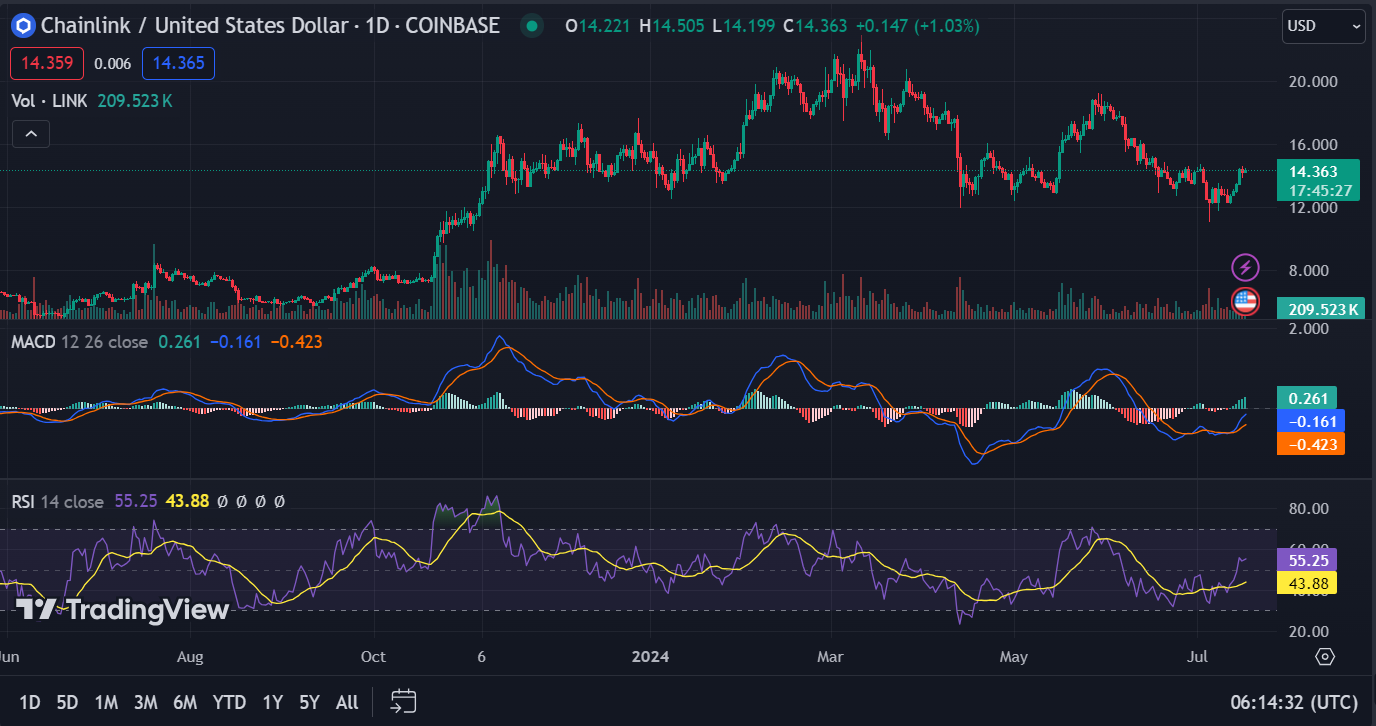
The Relative Strength Index (RSI) on the daily chart reads 54.76, suggesting a neutral sentiment in the market. Meanwhile, the Moving Average Convergence Divergence (MACD) indicator is trading above its signal line, hinting at a potential bullish trend in the near future.
As of press time LINK was trading around $14.30, and it has demonstrated resilience with a modest 0.79% increase in the last 24 hours.