
Bitcoin is currently in a pivotal phase as it approaches the crucial $70,000 resistance level as highlighted by Captain Faibik, an analyst. The 1-day BTC/USDT chart reveals a significant ascending triangle pattern, which suggests a potential continuation of the bullish trend. This pattern is characterized by a flat resistance line and a rising support line.
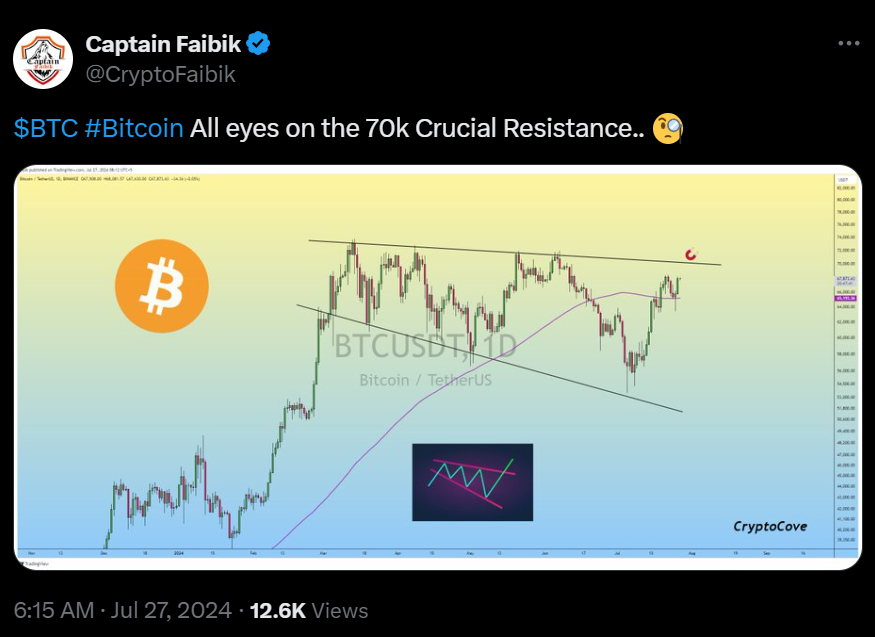
As of press time, Bitcoin is trading at $67,930.37, showing a 1.35% increase over the last 24 hours. This rise is complemented by a trading volume of $25,345,805,022. Analyzing the 200-day moving average (MA), Bitcoin remains above this critical level, reinforcing the bullish sentiment. The 200-day MA often serves as a significant support level, providing confidence for long-term investors.
Key support levels include $65,000, where the 200-day MA intersects, making it a strong support zone. Additionally, the $62,000 mark has acted as support during past pullbacks within the ascending triangle pattern. A lower support level of $58,000 aligns with the triangle’s ascending trendline, further supporting the bullish outlook.
Resistance levels are crucial for understanding Bitcoin’s next moves. The immediate resistance is at $68,000, which forms the upper boundary of the triangle pattern. A breakout above this level could indicate a continuation of the bullish trend.
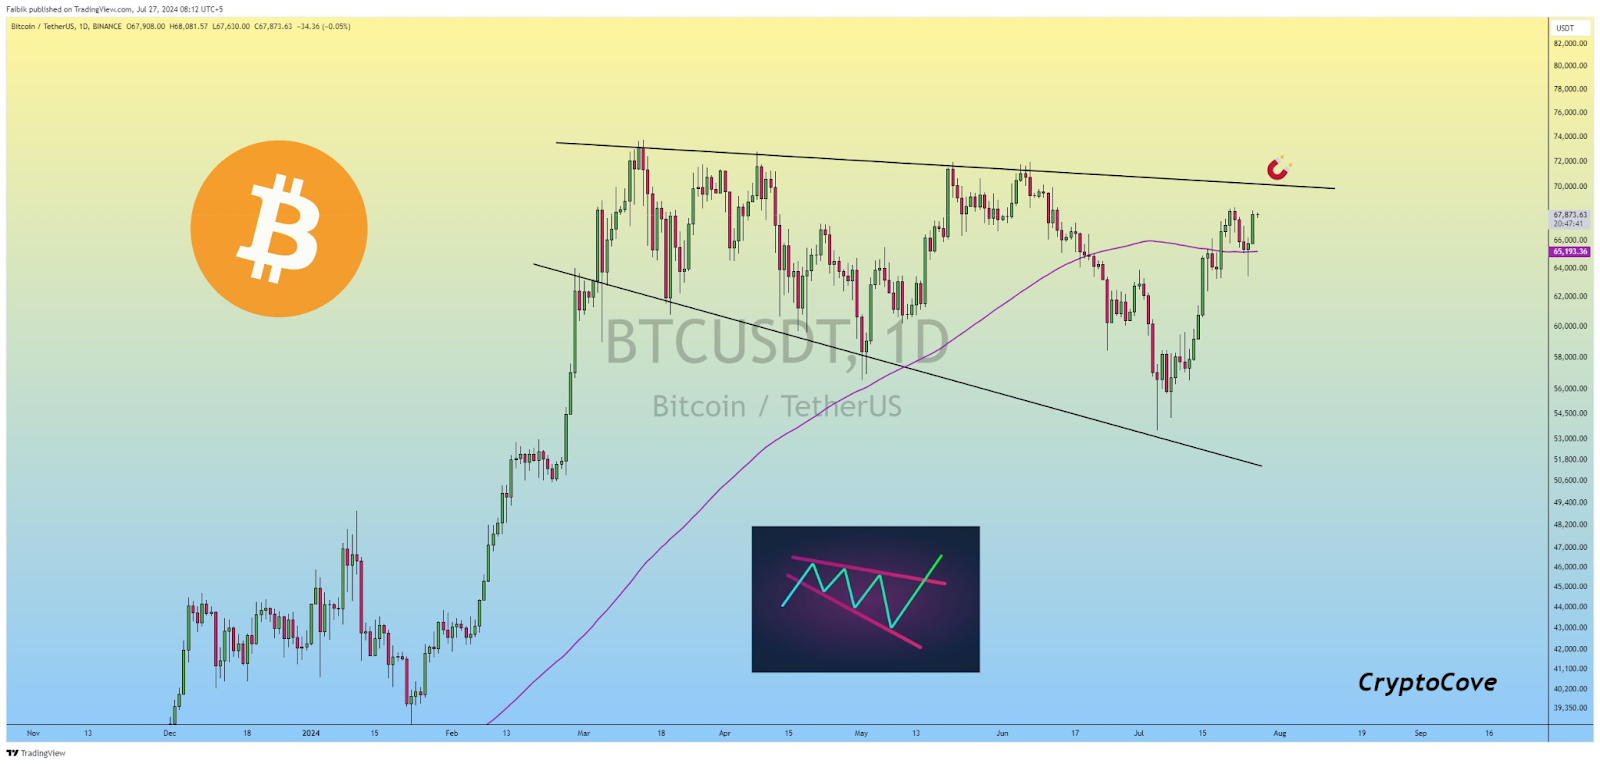
The next resistance which is at $70,000 could be a psychological level capable of triggering a selling pressure. Above this, the $72,000 level could pose another challenge, as Bitcoin previously faced rejection near this point.
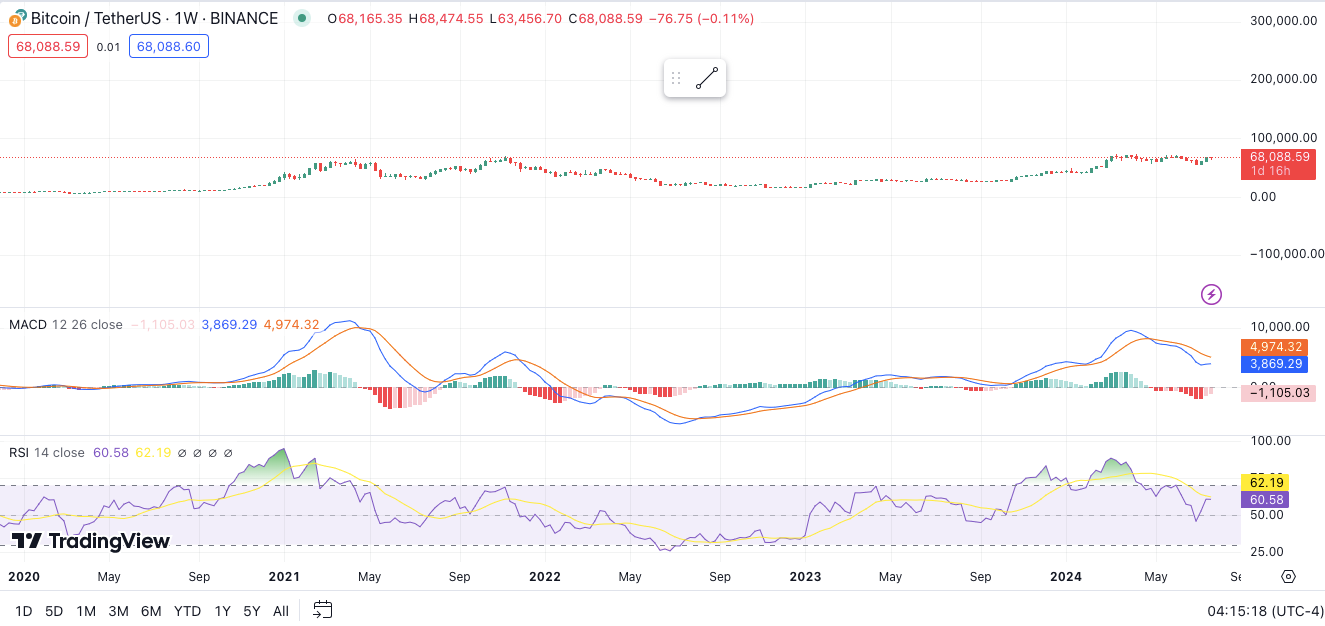
The 1-week Relative Strength Index (RSI) stands at 60.75. This suggests that Bitcoin may be slightly overbought but remains within a healthy range. Additionally, the 1-week Moving Average Convergence Divergence (MACD) is trading below the signal line, which could imply a potential bearish trend in the short term.